
ACM Commentary 3Q 2021
The third quarter of 2021 started very strong as the economy continued to work its way through the COVID pandemic. Corporate earnings continued their strong trajectory and consumers remained active. Equities across most sectors and capitalizations experienced moderate increases in July and August however, those gains were mostly erased as we moved through September. Positive market sentiment was quickly altered as news of real estate problems in China, a less than certain outlook for the Democratic driven infrastructure bill, rising inflation, and a resurgence in the delta variant all created a level of uncertainty that had not been seen for several quarters. For their part, markets corrected 5% as the uncertainty gained traction, and concerns that the economy was overheating were quickly replaced with deteriorating growth fears.
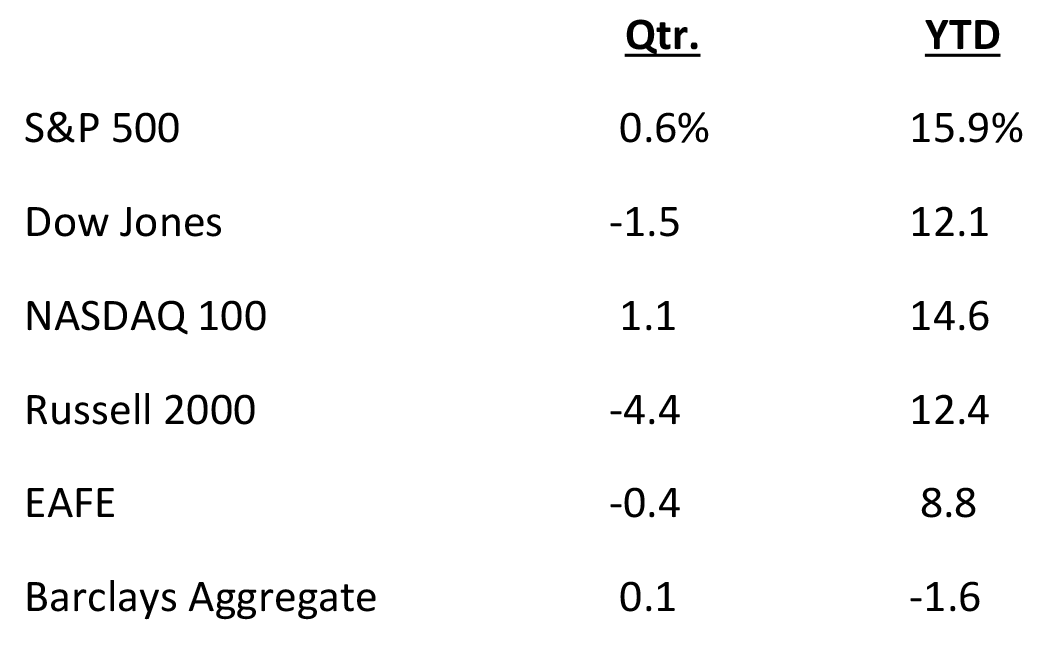
As shown below, despite the September weakness, markets were generally positive to slightly negative for the quarter with year-to-date returns remaining strong. During the quarter, large capitalization companies outperformed small caps while growth outperformed value. U.S equities remained the strongest on a global basis while developed markets strongly outperformed the emerging markets. Fixed income markets were generally flat for the quarter however with the September inflation fears, bonds sold off through the last two weeks of the quarter.
In our last quarterly writing we touched on the topic of the prospect of long-term inflation as a result of strong demand and Fed money-printing. We also touched on housing, which represents 1/3 of the overall Consumer Price Index (CPI). We identified a large future supply of housing stock in the U.S. as a potential offsetting impact on the risk of future inflationary pressure. This combined with the October revelation of a growing real estate crisis in China has added additional uncertainty, and to an extent further clouded the inflationary view.
Though, It is hard to argue that inflation is not presenting a clear and present challenge to consumers and business owners. This is especially true for low-income earners who have been hardest hit by the pandemic, and that suffer the most as prices for basic goods increase. However, the long-term rate of inflation is where the debate sits. All commodities, especially energy, are showing sharp increases due to global supply chain disruption and COVID related production shutdowns. We believe pricing will remain elevated but will moderate as the supply chain corrects and the restocking of shelves abates. Additionally, with the second largest economy in the world, a slowing China should add a dampening as China is the largest consumer of commodities. The impact of the supply chain on inflation is hard to understate and is revealed by separating inflation in goods vs services inflation in the U.S. economy. As you can see in the chart below, inflationary pressures within the services sector of the economy, though pronounced, have been much more tepid than that on the goods side. The chart depicts a breakdown of the 12-month percentage change of the Consumer Price Index (CPI), by all categories compared to just the Services components and is provided by the Bureau of Labor Statistics.

CPI has dramatically outpaced Services sector inflation in recent months. It has surged in excess of 5% since April of this year, was up 5.4% in September and at the close of October it increased to a concerning 6.2%. It had not previously exceeded 5% since the summer of 2008 and been higher than 6% since 1990. Ominously, both these prior time periods experienced recessions. The picture is a bit more comforting, though, when looking at the Services sector less energy where inflation has remained fairly in check. Curiously, over the past 20 years services inflation has run at a higher clip than CPI. This reflects the pivoting nature of the U.S. economy which has grown more service based in recent years and that segment of the commanding pricing power due to strong demand. However, CPI has drastically outpaced services inflation as we make our way out of the COVID crisis and the cost to import goods to the U.S. has temporarily increased forcing manufacturers to pass on those price increases to consumers. For example, prices have increased for new and used vehicles by 8.7% and 24.4% respectively through September of this year. Meanwhile the rent of a primary residence and owner’s equivalent rent were up 2.4% and 2.9% respectively. It is important to note that these increases are coming off of very low comps given the unprecedented complete closing of the economy in 2020. It is also difficult to foresee continued increases of this magnitude in the longer term.
No doubt the inflation debate has been a hot topic for investors and media pundits alike, but an even more dangerous concept emerged in September, instilling fright in investors. In part due to aforementioned economic challenges in China, and given the recent supply shocks, a growing concern developed that the global economy was not overheating, but rather slowing. This placed a considerable amount of pressure on already robust earnings expectations heading into the third quarter earnings season. The concern was that already existent inflation combined with a contracting economy would result in an even more dreaded stagflationary environment. Defined as persistent high inflation combined with high unemployment and stagnant demand, stagflation is feared because there really is no known antidote. This is because the normal responses to the two major components of stagflation—recession and inflation—are diametrically opposed. The cure for high inflation, or tighter monetary policy only acts to further punish the economy by further slowing growth and vice versa. Figure 2 depicts the google search activity for the topic “stagnation” the extent of stagnation concern entering into this fall.

As you can see, the last time the interest level was this high was in the months leading up to the great recession. Given this level of heightened interest a pullback in the markets in September is surely understandable.
After all, a fear of rising interest rates is to be expected given the continued massive fiscal and monetary accommodation since the arrival of the Coronavirus. Afterall, the supply of U.S. dollars increased by an unprecedented 25% in 2020 alone! However, an increase in the money supply is not in and of itself inflationary. This is especially the case if the printed dollars end up not as loans, but as deposits on banks’ balance sheets or savings in investment securities portfolios. We have discussed this in previous writings. For the remainder of this writing, we thought we would focus on the other key ingredient for stagflation – a slowing economy.
From our perspective it is hard to find significant signs of a slowing economy. In fact, there are several key measures that brighten the growth side of the stagflation fear:
October aggregate hours worked has increased by approximately 5% indicating a stronger employment outlook.
Sentiment across manufacturing and service industries, as measured by the ISM Composite PMI, is reporting above 62 which has historically been consistent with GDP growth of 5-6% annually.
Consumer spending as measured by credit card receipts are increasing, signaling consumer confidence.
Travel, which is also a strong indicator of consumer confidence, is growing as COVID fears are abating with increased vaccinations and lower infection rates.
Lastly, and perhaps most important as it relates to the Alamar equity strategy – corporate profits are growing at a pace that is even higher than last year.
At Alamar, we are focused on actively managing a portfolio of companies and less focused on predicting the economy, we have witnessed a continued undeniable strength in corporate performance as of late.
For its part and as reported by FactSet, The S&P 500 is on track to report earnings growth in excess of 30% for the third straight quarter. Additionally, despite all of the inflation talk about compressing margins, the S&P 500 is so far reporting its third highest profit margin since 2008. So, despite the rising fears of stagflation and economic slowdown, we feel very good about the prospects for corporate earnings and continued growth (Figure 3).

Turning the discussion to Alamar and our approach to investing, it is important to again highlight that we seek to identify a limited number of investment opportunities to structure our client portfolios. At the center of our philosophy is the desire to invest in and own companies that have a proven ability to generate good earnings growth. We do not seek to own the entire market, such as an index fund or ETF, but instead want to own superior companies on a variety of financial and qualitative metrics. The economic backdrop of inflation, changing monetary policy or even the fear of stagflation only creates volatility and valuation opportunities for us to take advantage of. We are excited by the companies we currently own as they continue to meet and in many cases exceed our expectations for growth and profitability. Further, we remain confident more great ideas will surface as the economic landscape ebbs and flows around this earnings season, as well as those to come.
We will continue to monitor economic conditions and make adjustments to our portfolio based on individual company fundamentals. We sincerely appreciate the opportunity to invest alongside, and on behalf, of our current clients. We would welcome the opportunity to further discuss our investment philosophy, and process with those who have not found your way to invest with us yet.
Please continue to stay safe and healthy –
Best regards,
John Murphy, CFA Chris Crawshaw, CFA
DISCLOSURES
The views expressed in this note are initially published and are subject to change without notice. Alamar has no obligation or duty to update the information contained in this note. Past performance is not an indication of future results. Risk is inherent in investments and involves the possibility of loss. Net of fee performance is calculated using the highest fee. The Russell 3000 Index measures the performance of the largest 3000 U.S. companies representing approximately 98% of the investable U.S. equity market. The S&P 500 Index, which is a market-capitalization weighted index containing the 500 most widely held companies chosen with respect to market size, liquidity, and industry.
This publication is made available for informational purposes only and should not be used for any other purpose. This report should not be construed as a solicitation of an offer to buy or sell any security. Information contained herein was obtained and derived from independent third-party sources. Alamar Capital Management, LLC believes the sources are reliable; however, it cannot guarantee the accuracy of such information and has not independently verified the accuracy or completeness of such information.
This publication, and the information contained herein, may not be copied, reproduced, republished, or posted in whole or in part, in any form or media without the prior written consent of Alamar Capital.