
ACM Commentary 2Q 2021
Halfway through 2021, our forecasts for this year are on track. Thanks to the rapid rollout of vaccines, the Covid-19 viral outbreak seems to be getting under control. While the emergence of variants such as Delta and Lambda needs to be watched carefully, studies so far indicate that the vaccines protect against severe outcomes. As a result, the US economy is booming! Almost all of our investments have beaten their outlook and raised guidance for this year. We expect this trend to continue for the rest of the year.
In our view, the biggest overhang on the market now is the prospect for long-term inflation. Many economists and market experts are forecasting a long period of rising inflation because of strong demand and Fed money printing. We are doubtful their forecasts will come to fruition. There are many long-term trends keeping inflationary forces at bay such as demographics (aging and slow growing population) and declining money velocity; we will delve into one important one – housing costs – in this note.
BACK TO THE 70’s SHOW?
Inflation, as measured by the Consumer Price Index (CPI), is rising rapidly recently. Figure 1 shows the CPI over the last six decades. After moderating for the last 30 years, headline inflation has spiked recently to over 5%. There are fears in the market that we may be heading to a period of sustained inflation reminiscent of the 1970s. Market experts point to rising prices of commodities such as oil, lumber, corn, wheat, and soybeans as indicators of inflationary pressures to come. Another factor, that directly hits consumers and is a large portion of the CPI index, is housing. Housing prices are rising across the board, particularly at the low-end. Figure 2 depicts the Case-Shiller index for national house prices. After peaking in mid-2006 house prices collapsed over 25%, bottoming out in early 2012. Now prices are booming again, up 85% from the bottom. The chart clearly shows that prices are once again moving away from long-term trends. The trigger for the breakout was the Covid-19 pandemic since prices didn’t begin their recent spike until 2H 2020. Covid-19 spurred a furious demand for homes because people wanted to get away from dense environments. Work-from anywhere allowed homeowners to move away from expensive urban, primarily coastal, cities to states like Texas, Nevada and Arizona where they could purchase newer, larger homes with a yard for a lower price. In many cases the monthly mortgage payment was lower than their prior rental payment due to low mortgage rates and cheaper land prices.
This dramatic increase in demand for housing has led to furious bidding wars for homes. Inventory for both new and existing homes have fallen to all-time lows. Figure 3 depicts months of available housing inventory at current selling rates. Housing inventory is now roughly 2 months for existing homes and below 4 months for new homes. This is a faster pace than back during the 2005 housing bubble when inventory for existing homes was 4 months.


Housing is a very important contributor to overall inflation since it represents approximately 33% of the overall CPI index. Hence, the future course of house prices, and more importantly, rents, will be crucial to determine the pace of inflation. So, why are we so
sanguine about future inflationary pressures given the dynamics affecting house prices? The answer lies in the future supply of housing. There is a tsunami of new housing units coming on the market in the next few years.
For many years we have surveyed new housing units built by a large group of home builders. Figure 4 plots the total single family units ordered and delivered by this group. As you can see from the graph, orders for new housing peaked in Q4 2005 at 83,000 units in our sample; deliveries followed 6 months later. Following the housing bust, units ordered and delivered fell 75% to roughly 20,000 units, bottoming out in 2011. Since then housing has been on a steady uptrend and has now accelerated with the onset of the pandemic. Orders this year will comfortably break the prior peak. It is a great time to purchase a new house, particularly if you are willing to relocate from the expensive coastal cities to the middle of the country. Unlike existing homes, new home prices relative to incomes have never been lower. Figure 5 plots new home prices in our sample and Figure 6 plots new home prices relative to per capita disposable household income.


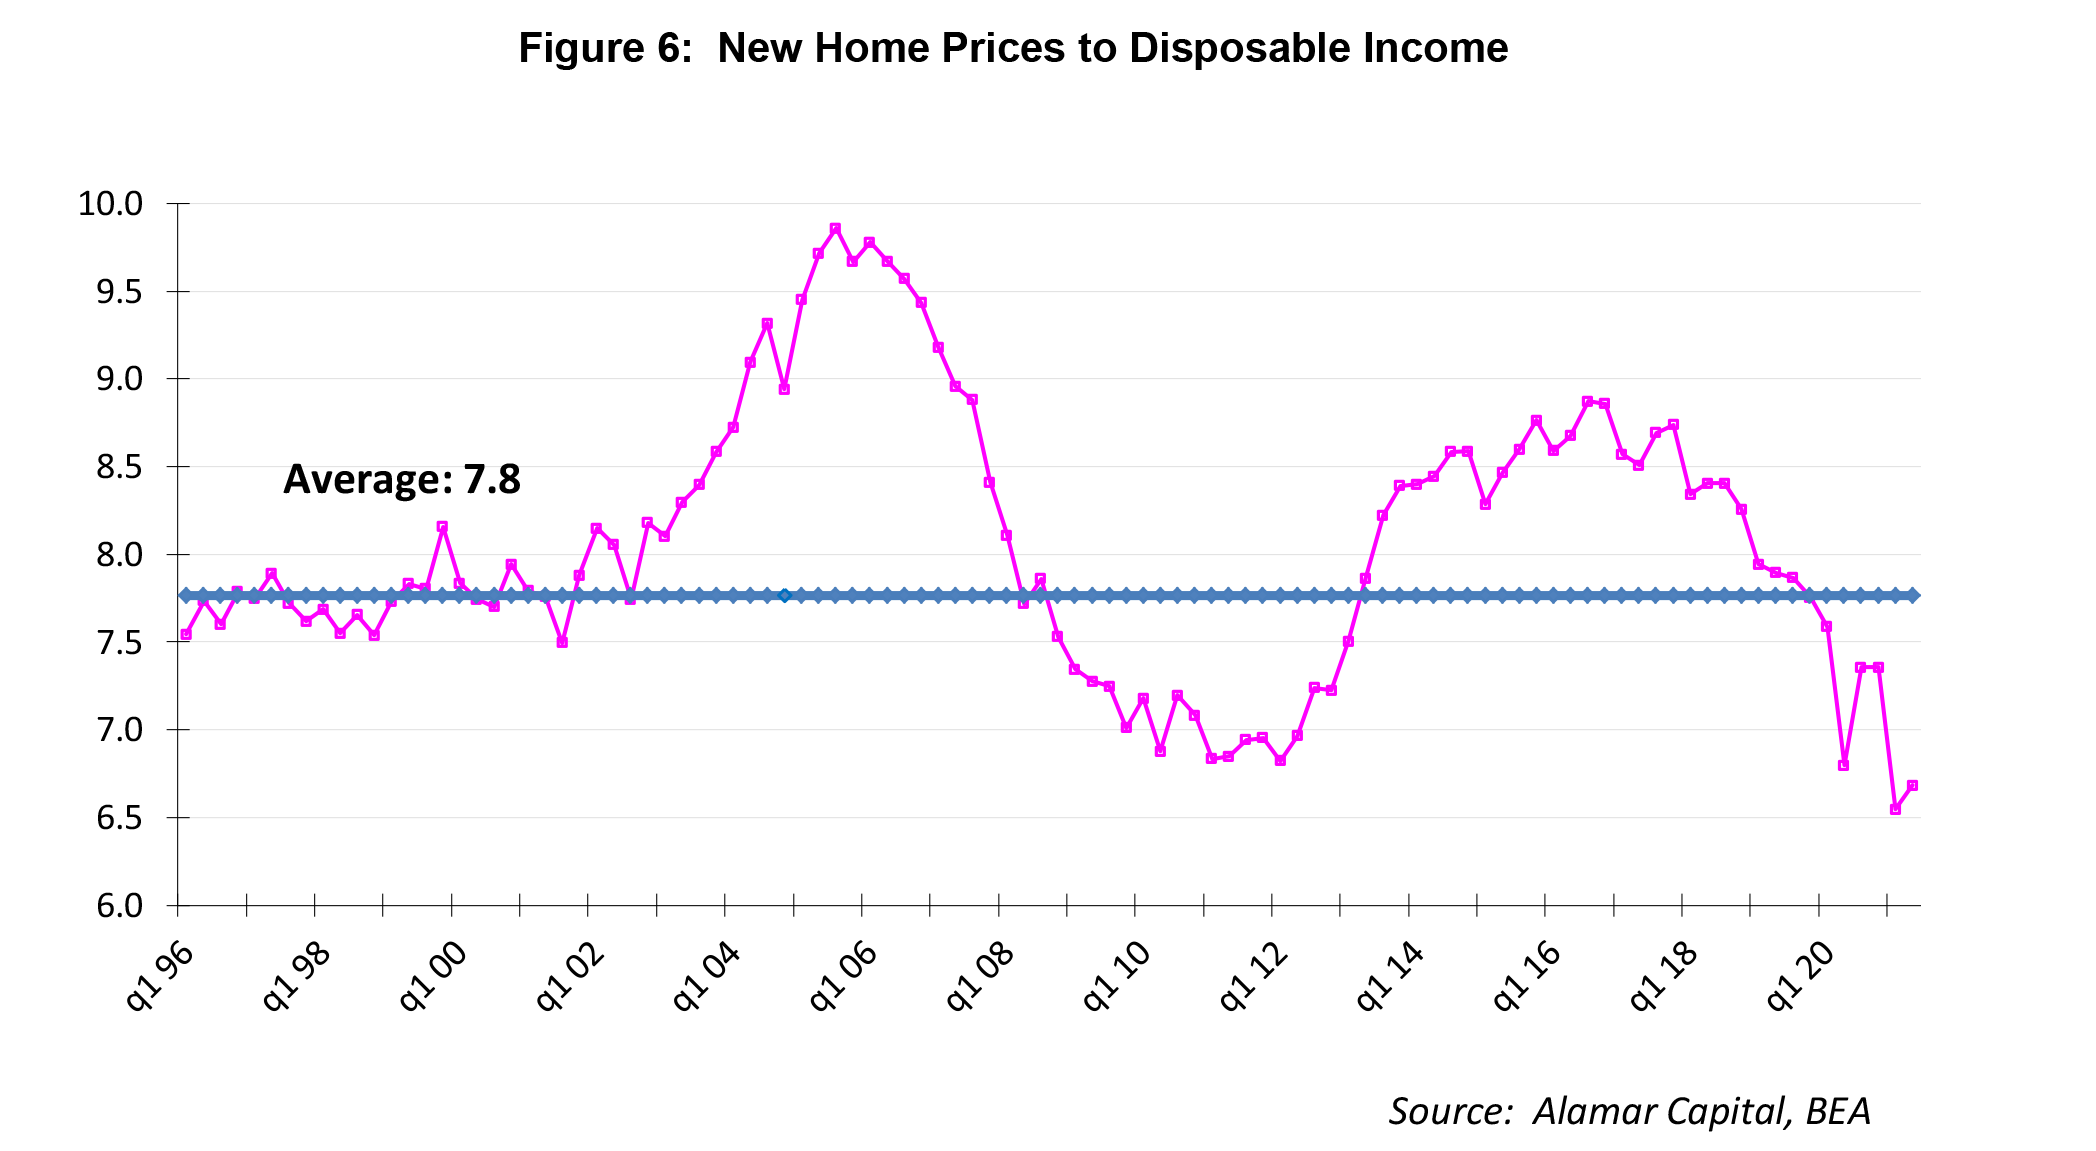
As you can see, new home prices are averaging roughly $390,000 nationwide in our sample. Note that our sample includes all the major homebuilders who build homes across all regions of the country. Unlike existing homes, average new home prices have barely budged since 2015. To be sure, our sample captures geographic mix transfers as demand shifts across the country. When a homeowner sells their house in California and purchases a new house in Texas, demand shifts from an expensive to a more cost-effective region. Our sample captures this shift, while a price index such as the S&P Case-Shiller does not. If their income in Texas is roughly similar to what they were earning in California, their home price-to-income ratio will decline substantially. They will save a lot of money while at the same time upgrading to a brand new house with all the latest amenities.
We expect this dynamic to continue given the advent of work-from-anywhere and companies moving from expensive locales to more cost-effective interiors. As a result we forecast the delivery of new homes to continue to build from here. The supply of new, lower priced homes will inevitably dampen price increases on existing homes and rents. The best cure to a high price is a high price.
CONCLUDING THOUGHTS
We have a constructive outlook on the market for the rest of the year and beyond. We are finding good, reasonably priced investments in the current environment. Moreover, most of our current investments have easily beaten our expectations and raised guidance, and we expect that to continue this quarter. Unlike many experts, we are not overly concerned with long-term inflationary pressures. The biggest driver of inflation, housing costs, will likely ameliorate over time as a surge of new housing supply hits the market. There has never been a better time to purchase a new home, especially if you are a renter in a high priced coastal city, provided you are willing to relocate.
Thank you for your continued trust and confidence in Alamar Capital Management.
Sincerely,
George Tharakan, CFA
george@alamarcapital.com
Disclosures
The views expressed in this note are as of the date initially published and are subject to change without notice. Alamar has no obligation or duty to update the information contained in this note. Past performance is not an indication of future results. Risk is inherent in investments and involves the possibility of loss.
This publication is made available for informational purposes only and should not be used for any other purpose. In particular, this report should not be construed as a solicitation of an offer to buy or sell any security. Information contained herein was obtained and derived from independent third-party sources. Alamar Capital Management, LLC believes the sources are reliable; however, it cannot guarantee the accuracy of such information and has not independently verified the accuracy or completeness of such information.
This publication, and the information contained herein, may not be copied, reproduced, republished, or posted in whole or in part, in any form or media without the prior written consent of Alamar Capital.