
ACM Commentary 1Q 2021
With the arrival of March, we stumbled across the one-year anniversary of the COVID-19 related global lockdowns that resulted in the fastest and deepest contraction in the economy since WW II. There is much to celebrate this spring, most notably continued and accelerating progress on the vaccination front.
By the end of March more than 150 million Covid vaccines had been administered in the United States. As of this writing, more than 3 million shots are being injected into the arms of U.S. citizens per day. A remarkable scientific achievement, especially given where we were just 12 months ago. It is likely that Covid-19 will be with us for many years to come and a continual evolution of the virus with additional strains is to be expected. However, the march towards herd immunity continues, and fortunately, the current round of vaccinations has proven effective against known mutations so far. In one of the largest signs of progress, just this week the CDC lifted mask requirements in outdoor spaces for US citizens who are fully vaccinated.
This news, combined with the continuation of massively accommodative fiscal and monetary policies, added to an already pre-existing risk on sentiment for investors in the quarter. This was particularly evident in the month of March as shown below. For our part at Alamar, we anticipate the economy to continue to accelerate in the months ahead given the continued steady reopening of the economy’s service sector and strong monetary and fiscal support. The returns in the market are, of course, more difficult to predict in the short term. However, it is fair to say that few, if any, investors anticipated the returns that have been generated and the progress that has been made in the past year. Additionally, a sudden and dramatic spike in interest rates during the quarter, attributable to inflationary risk, has begun to fray investor nerves, particularly in the fixed income market. The chart in Figure 1 below depicts the performance of various asset classes over several different time periods.
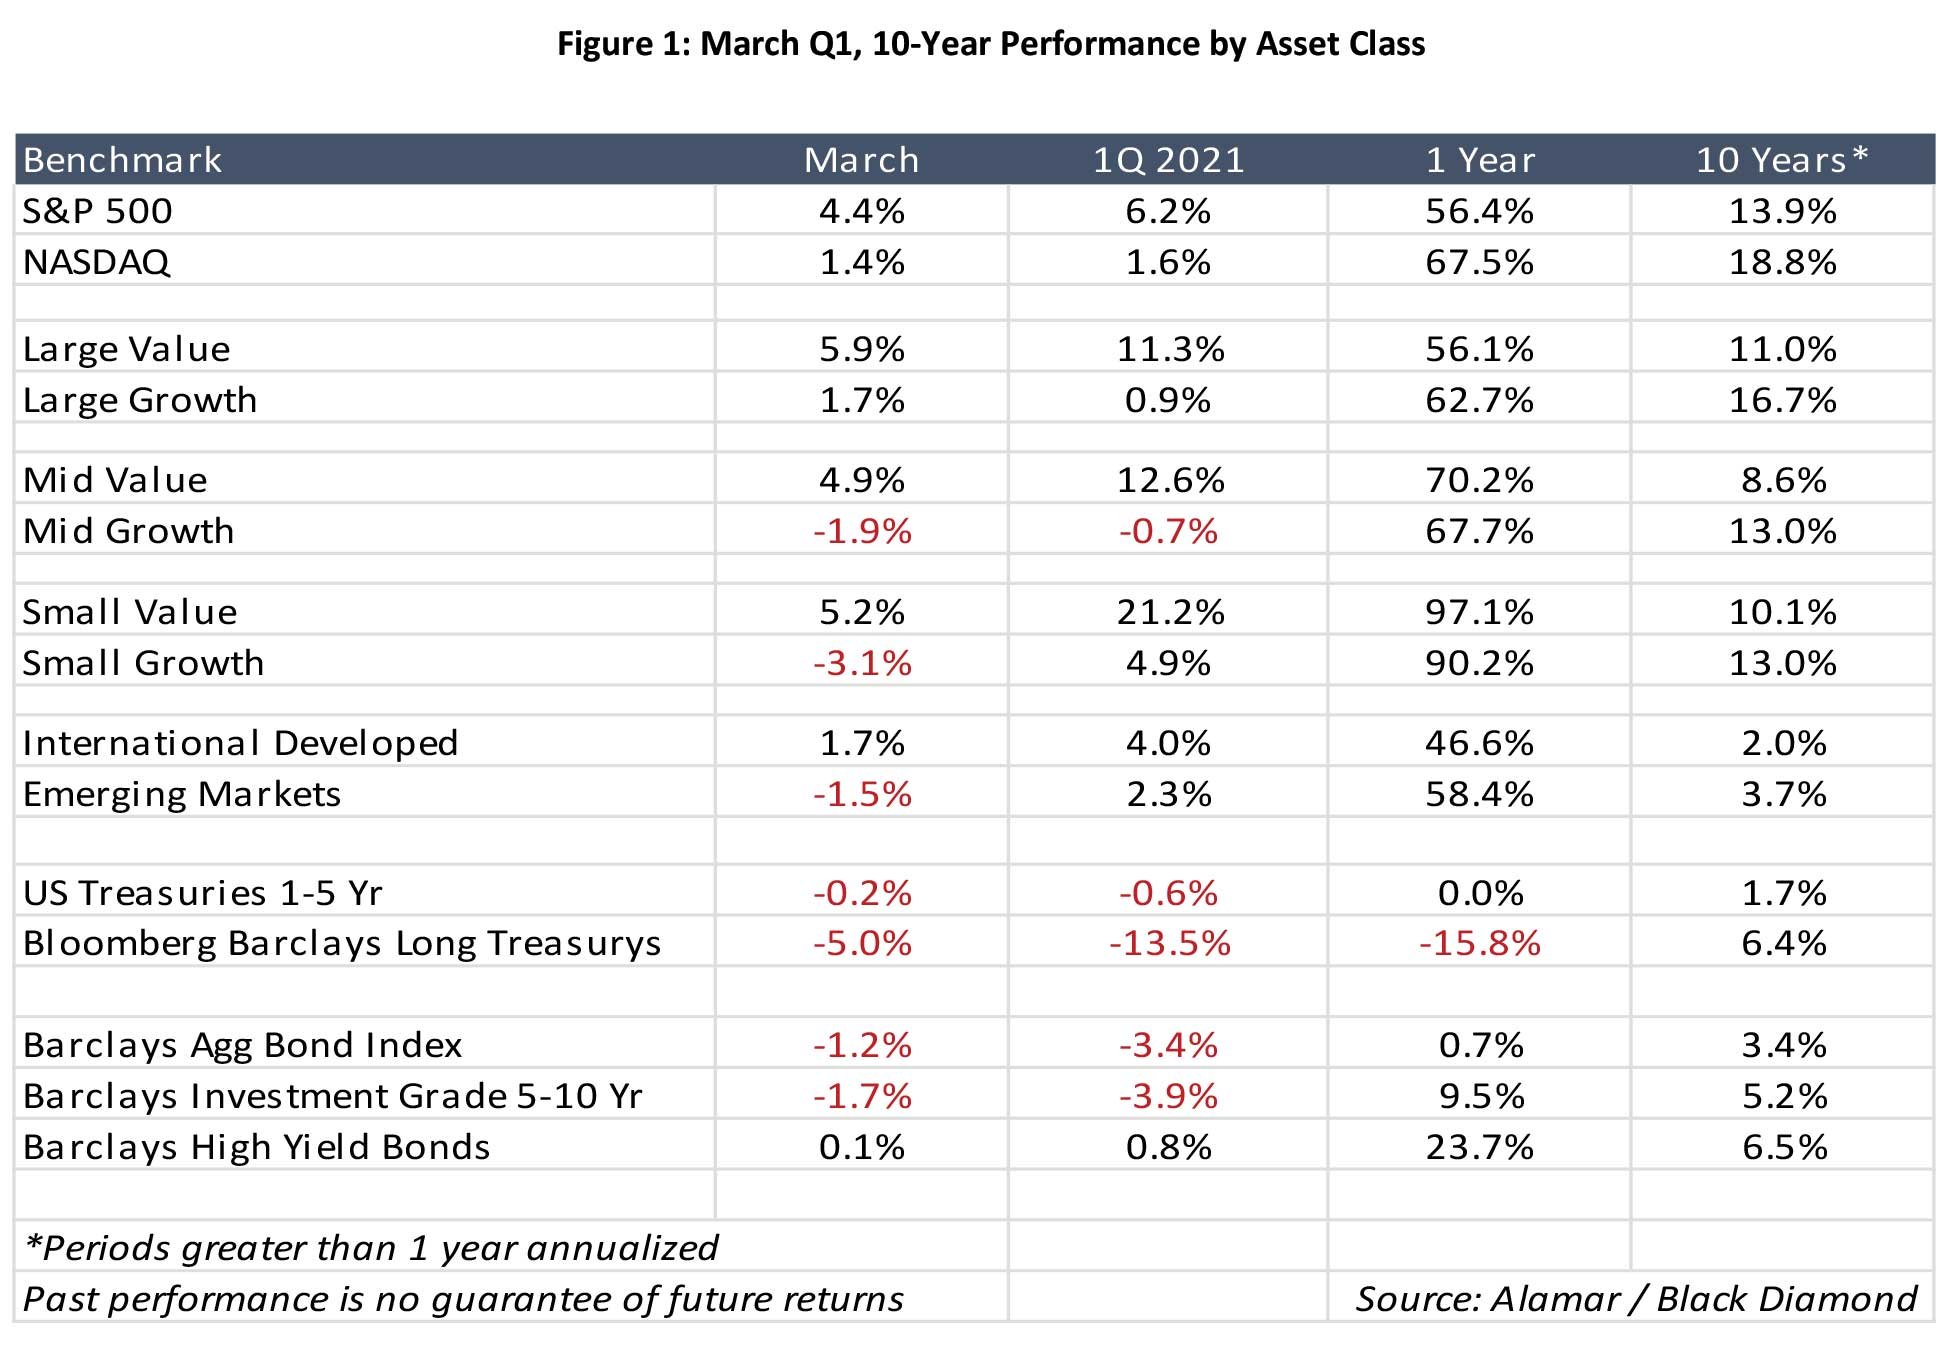
As you can see from the chart, equity investors across the board were rewarded in the quarter, with value outperforming growth. As we discussed towards the end of last year, we view this as a positive development relative to the health of the overall stock market. Older economy value names have reacted favorably to progress on the vaccination front and the beginning of the end of the Covid crisis. Additionally, a spike in interest rates had a deteriorating effect on the valuations of higher-growing companies in the economy. The present value of their future cash flows is discounted back at a higher-level, necessitating lower current valuation.
Likewise, higher rates had a similar negative impact on the fixed income market. This is because higher current interest rates require that bond prices be reduced to allow the purchaser of a bond to secure a yield that is in line with the current environment, not the date in which the bond was issued. In what has been a very low interest rate environment, credit investors have been left with two choices to increase the yield in their portfolios: either extend the maturity of the bonds they purchase- in simpler terms lend money for a longer period- or increase the credit risk of their portfolio by lending to less creditworthy borrowers. A continued improvement in the economy saw a varied outcome based on these two choices. High yield bonds sought out small gains in the quarter as credit spreads shortened and defaults reached multi-year lows. Meanwhile, the bell weather Barclays Aggregate bond index was down -3.4% in the quarter, while intermediate corporate bonds fell by a similar -3.9%. With long-term treasuries down -13.5% in the quarter. Investors who lent out for the long haul were hit the hardest. This recent move reverses a trend in the earlier innings of the Covid-19 Crisis, when the dramatic and somewhat shocking fall in rates rewarded long term bond holders. The sharp move in rates in the quarter can be seen in the chart below, which depicts the yield on 10 Year US treasury bonds dating back to before the financial crisis.

The current prevailing view is that Real GDP growth in the U.S. economy will exceed 6% this year and the recent move in interest rates is attributed to the view that the combination of stimulus and rapid growth will lead to rising prices. After all, the U.S. Economy experienced stubbornly high inflation in the 1970’s and early 1980’s, last reaching double digits in 1981 (Figure 3). It is the view of most economists that this was caused by overly expansionary monetary and fiscal policies, along with significant increases in energy prices. That resulted in Fed Chairman Paul Volker courageously raising short term interest rates in the early 1980s to bring down inflation, but at the cost of a recession. Since 1991 inflation has remained below 5%. Further, for the great majority of the period since the 2007 – 2009 Great Recession, inflation has been below the Fed’s target of 2%, which it established as its goal in 2012. This, despite fiscal and monetary policy, has been dramatically more stimulative than the high inflation period of the 1970s and early 80’s.

The question left for investors today is whether things are different this go-around, or if we are doomed to repeat the same fate. For our part at Alamar, we are not convinced inflation is at hand, at least not yet, and the Federal Reserve appears to agree with us. The Great Recession and COVID-19 induced recession represent the two deepest recessions since the Great Depression. In both downturns, rapidly rising unemployment made inflation unlikely. Despite the massive stimulus, inflation has remained contained, as unemployment rates had been falling dramatically in the years preceding the COVID-19 pandemic.
This has likely emboldened the Fed. Overlooking growing concerns, they have pledged to keep short-term interest rates at zero until the economy reaches full employment and inflation is modestly above 2%, which Fed leadership does not expect until 2023 at the earliest. Figure 4 below is provided by the St. Louis Fed and it indicates both their actual and projected inflation rates in the near term.
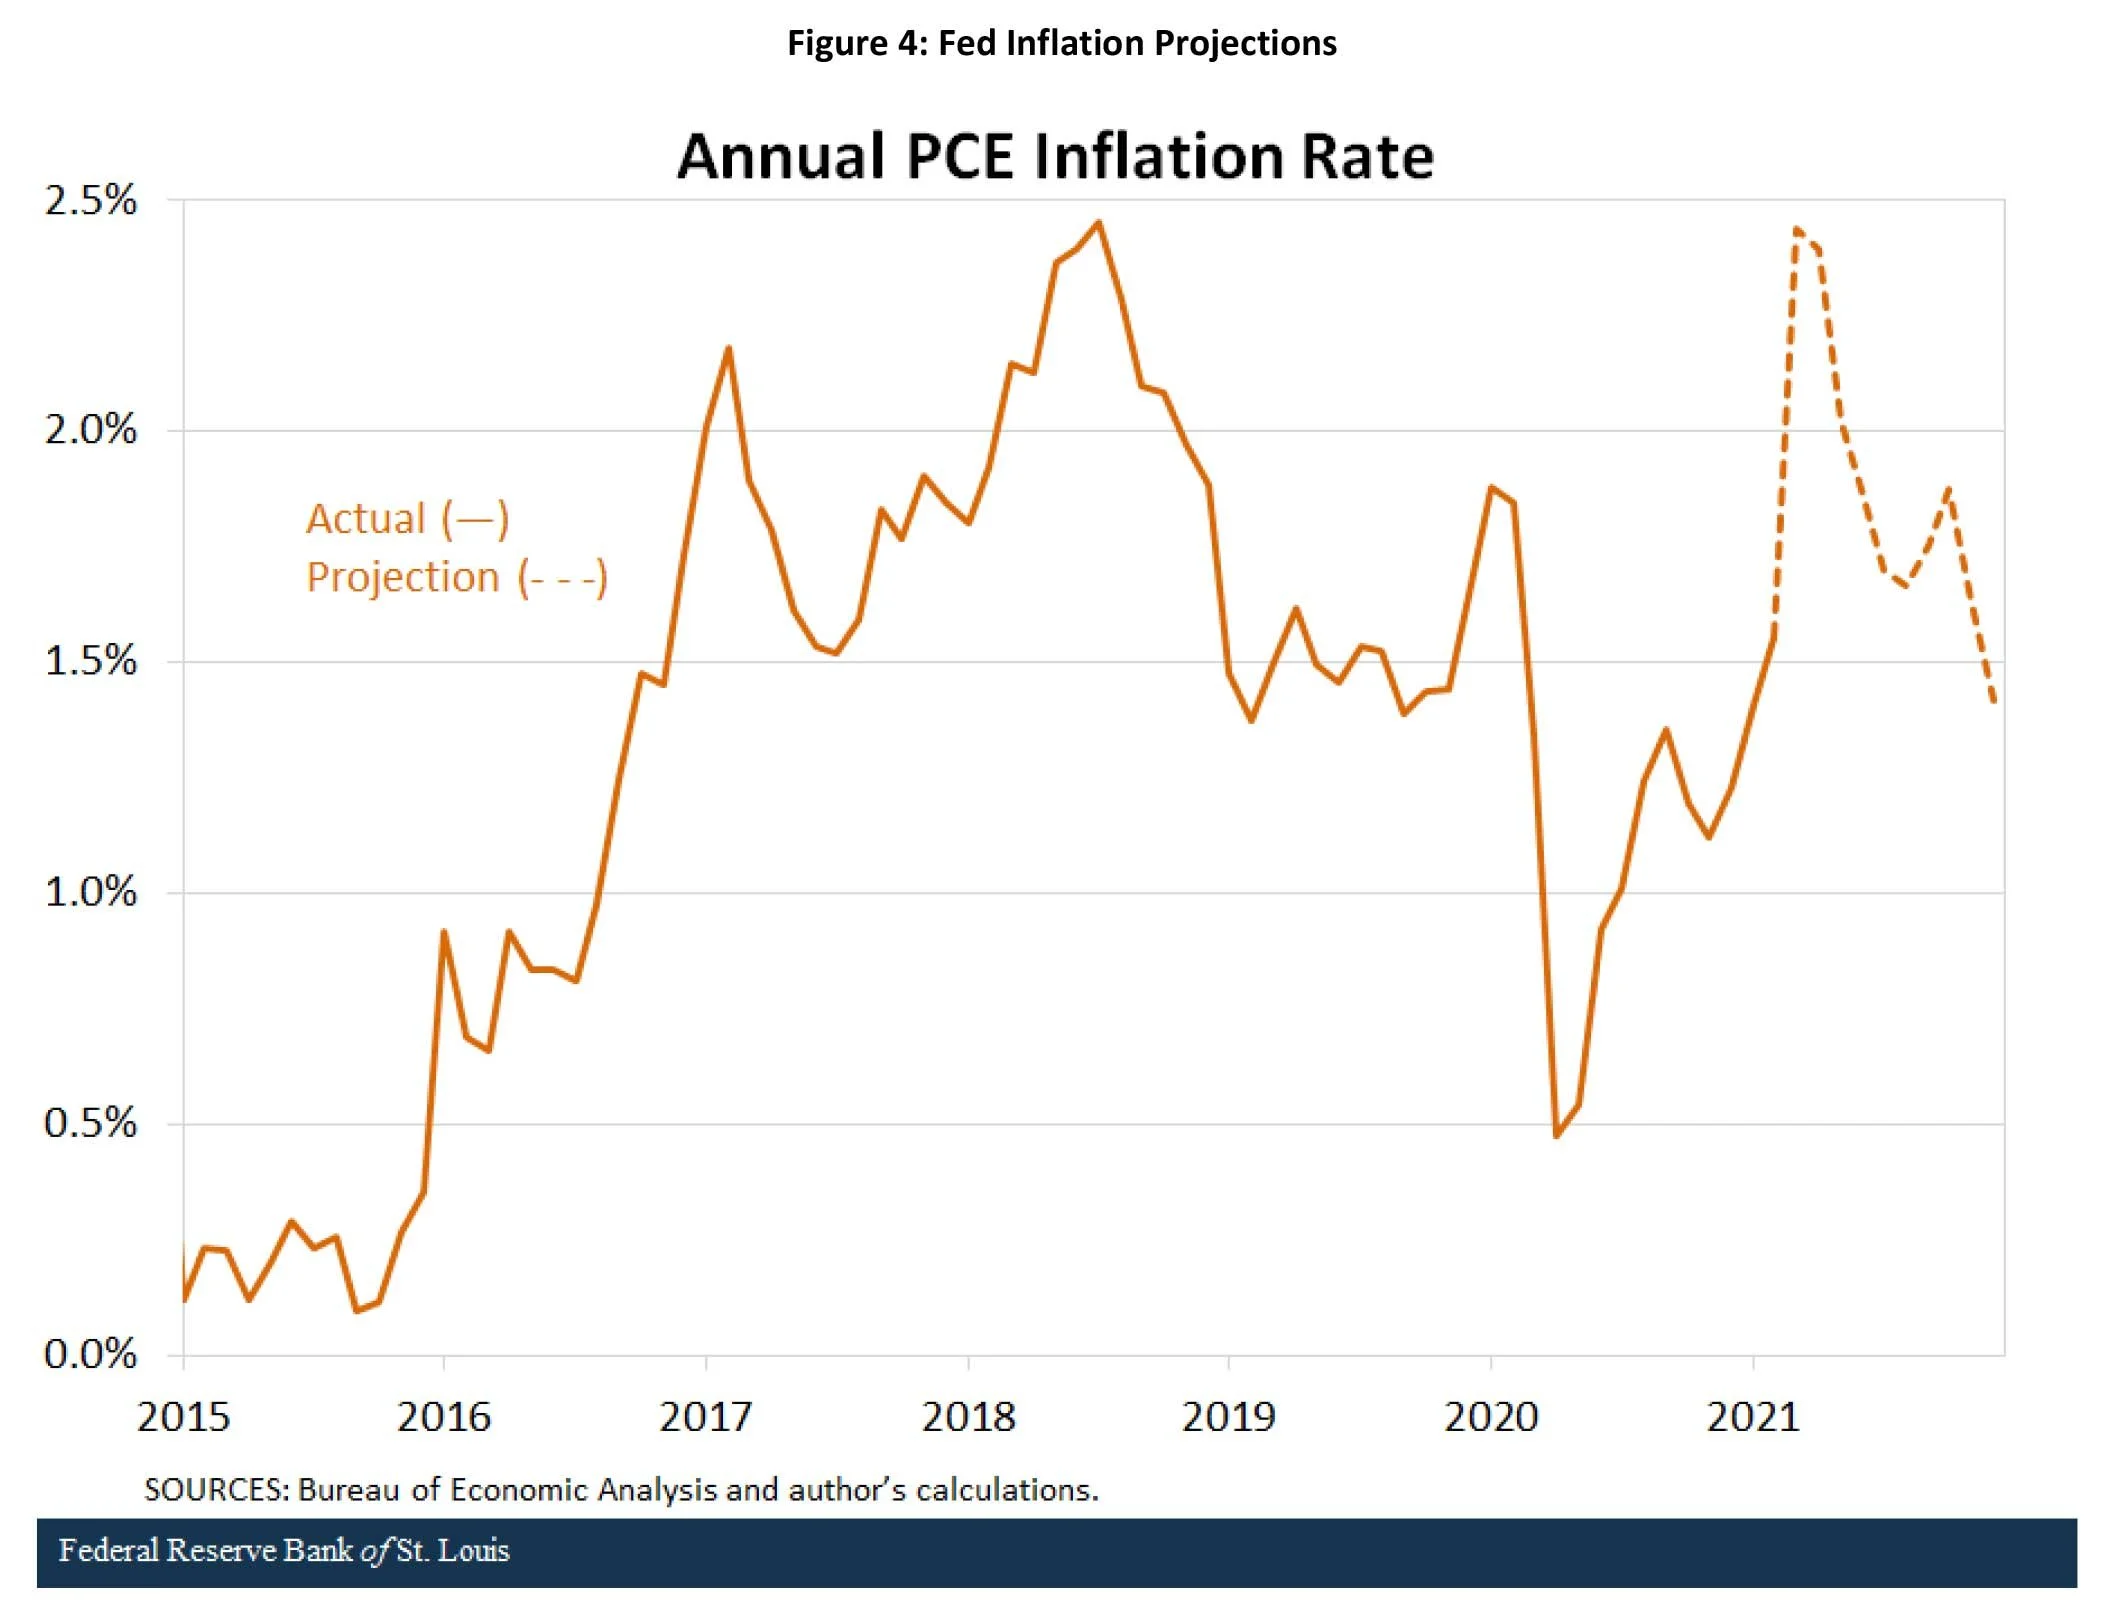
Their projections for inflation include a brief spike in the spring and then a convergence back towards the pre-pandemic average nearing the end of 2021. In other words, we should not expect the Fed to react to a “temporary” rise in inflation. This view, combined with continued stimulus is a bullish indicator for the equity markets, and perhaps even fixed income if the Fed’s thesis plays out as predicted.
On the fiscal side the budget deficit is projected to be around 15% of GDP in 2021. On March 11th, the $1.9 trillion American Rescue Plan was signed into law. This stimulus clearly acted as a tailwind for the economy, enabling many to purchase necessary goods and services.
However, another large beneficiary appears to be the stock market itself. According to data aggregation company Envestnet Yodlee, many consumers used at least some of that money to speculate in the stock market; their research indicates that securities trading was among the most common uses for the government stimulus checks across nearly every income bracket. Interestingly, the numbers were particularly high for those in the $35,000 to $75,000 income bracket, where trading came in third behind only increasing savings and cash withdrawals.
Not to be outdone by the American Rescue Plan, further fiscal stimulus has been proposed through a $2.25 trillion American Jobs Plan. Anticipated to be spent over 8 years, the plan has garnered much attention for its very broad interpretation of “infrastructure”. The plan is summarized below in Figure 5.

Though it does commit up to $621 billion to politically consensus building infrastructure-oriented segments like highways bridges and roads $115 billion, Public transit $85 billion and passenger and freight rail $80 Billion. Much to the consternation of many Republicans, it also incorporates a $650 billion Infrastructure at Home component allotted to investments less related to infrastructure, such as $213 billion reserved for affordable and sustainable housing and $137 Billion for public schools. Further, the plan allocates $400 billion to a Caretaking component for home and community-based care for the elderly and disabled. A closer look at the traditional Transportation and Infrastructure segment also shows $174 billion reserved for electric vehicles. In recent days, the Republican leadership has offered a scaled-back $800 billion Infrastructure plan of their own. It is clear further negotiation will lead to a deal.
Shifting our focus to the stock market, the picture is also quite rosy at present. So far in the first quarter, earnings growth has been very strong, with a significant number of companies in the S&P 500 beating already optimistic Wall Street expectations. Below you will find historical and projected earnings and profitability on the S&P 500 and Nasdaq dating back to the Great Recession. As you can see from the chart, according to FactSet projections the S&P 500 is currently projected to grow earnings by 33% in 2021, and 12% in 2022.
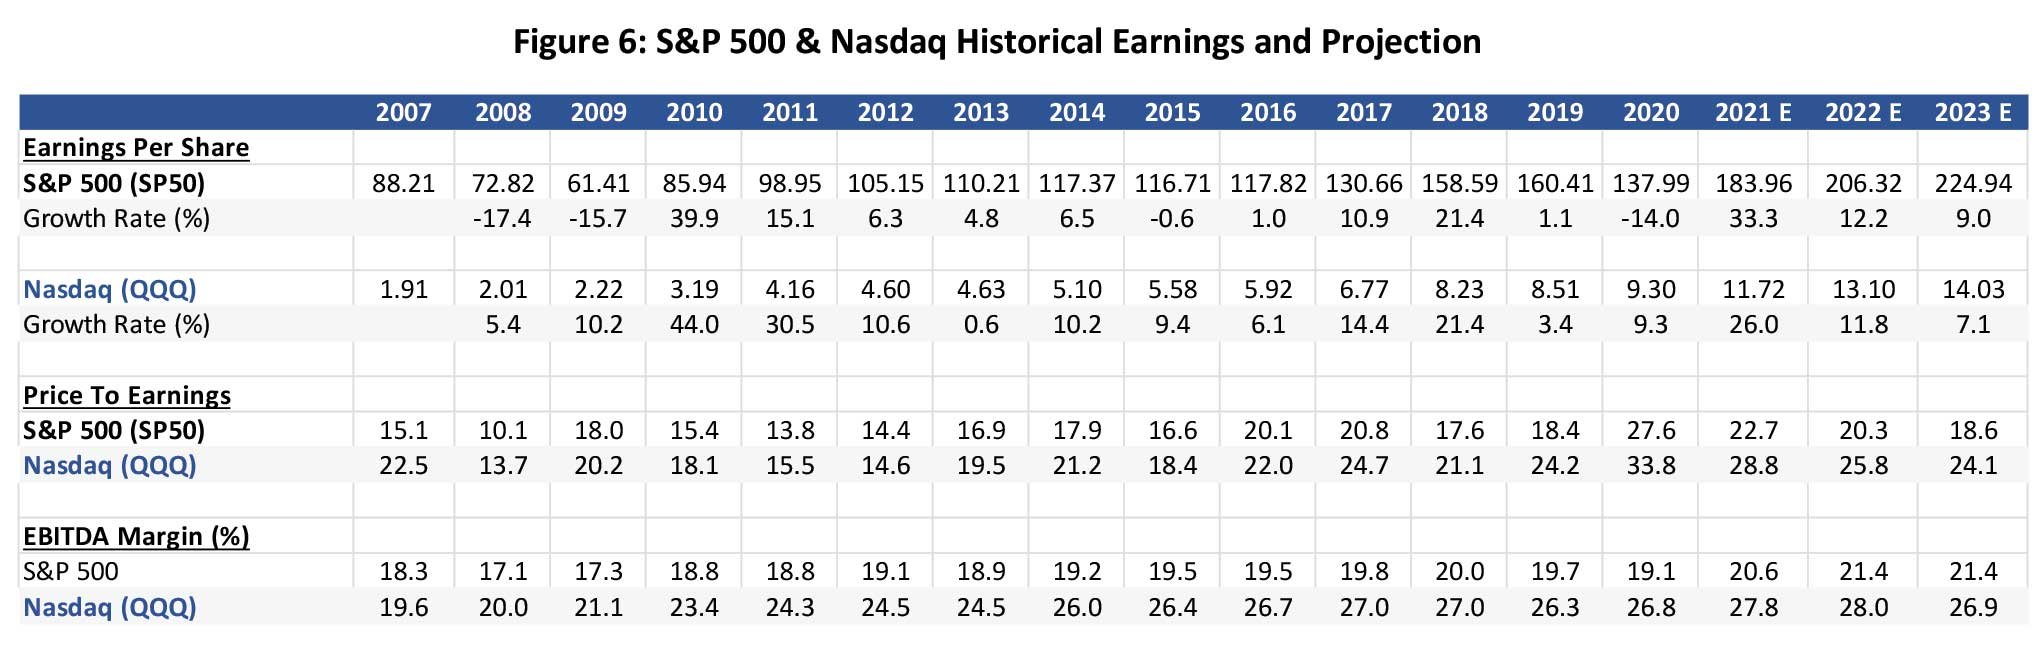
The newer economy Nasdaq is projected to grow at slightly lower levels, but with considerably higher profitability (Ebitda margins) over the same period. Also notable from the data has been the propensity for the Nasdaq names to achieve positive EPS growth during both the 2008-09 Great Recession and the last year (9.3% vs -14.0%), a feat that the S&P was not able to accomplish.
The combination of Covid pandemic relief, massive fiscal and monetary stimulus, accommodative Fed posturing, and solid earnings and profitability growth has made for strong market returns and a nice back drop for the economy and market looking forward. At Alamar, we continue to find attractive ideas for investment in our portfolio.
Please continue to stay safe and healthy –
Best regards,
John Murphy, CFA
DISCLOSURES
The views expressed in this note are initially published and are subject to change without notice. Alamar has no obligation or duty to update the information contained in this note. Past performance is not an indication of future results. Risk is inherent in investments and involves the possibility of loss. Net of fee performance is calculated using the highest fee. The Russell 3000 Index measures the performance of the largest 3000 U.S. companies representing approximately 98% of the investable U.S. equity market. The S&P 500 Index, which is a market-capitalization weighted index containing the 500 most widely held companies chosen with respect to market size, liquidity, and industry.
This publication is made available for informational purposes only and should not be used for any other purpose. This report should not be construed as a solicitation of an offer to buy or sell any security. Information contained herein was obtained and derived from independent third-party sources. Alamar Capital Management, LLC believes the sources are reliable; however, it cannot guarantee the accuracy of such information and has not independently verified the accuracy or completeness of such information.
This publication, and the information contained herein, may not be copied, reproduced, republished, or posted in whole or in part, in any form or media without the prior written consent of Alamar Capital.