
ACM Commentary 4Q 2016
The election of Donald Trump as the next US President led to a furious market rally in the 4th quarter. The S&P500 was up almost 6% in the last 2 months of the year, roughly half of the full year’s gain of 12%. Most of the gains were led by the cyclical sectors of the economy such as banks and industrials. Unfortunately, we were not expecting such an election outcome and, as has been the case for many years, had no exposure to banks. As a result we were up 4.1%, net of fees, for the full year. We typically do not invest in “high-flyers” or momentum names and therefore the risk we incur is less than the market. Our “beta” (a measure of risk) continues to be less than the market and on a risk-adjusted basis we have outperformed the market since inception by 3.2% annually (also known as “alpha” in the investing vernacular).
The economy continues to chug along at a moderate pace and President Trump will face some financial constraints to bring his election promises to fruition. We will discuss both the current state of the economy and the potential headwinds in this writing.
THE 1-2-3 ECONOMY
First, some clarification of economic terminology: while the press and economic commentators focus on real GDP growth, what matters to companies and investors is nominal GDP. Nominal GDP is the current value of all economic output while real GDP is the size of economy after adjusting for inflation. When companies report revenues and profits we are looking at nominal numbers, not adjusted for inflation. As seen in Figure 1, nominal growth has recently slowed to roughly 2% in 2016 from 4% earlier in the recovery. The average growth rate of the US economy from 2010 is roughly 3%. We call this the 1-2-3 economy: roughly 1% inflation and 2% real GDP growth leading to 3% nominal growth. The 1-2-3 economy is also supported by the results posted by large retailers such as Costco & WalMart which sell everything from soap to cars. WalMart has reported sub-3% same-store sales ever since the recovery began while Costco reported higher growth earlier in the recovery but has reported sub-3% same-store sales since early 2015. We estimate total loan growth reported by banks will also be less than 3% once the final 2016 numbers are tabulated.
Note that the 1-2-3 economy is very different from growth rates experienced prior to the 2008 recession. Back then nominal growth rates were more like 6% as seen in the figure. We refer to those halcyon days as the 3-3-6 economy (3% inflation & 3% real GDP leading to 6% nominal growth). As can be surmised, the difference between 3% and 6% growth is enormous, over time. In a decade, the 6% economy will be 33% larger than a 3% economy. A faster economy results in more sales, higher wages and a better standard of living. Investors also pay up for faster growth – to earn a 10% return, investors will pay a 25x P/E multiple for 6% growth but only a 14x multiple for growth of 3% since higher growth warrants a lower P/E multiple.

THE FISCAL STRAITJACKET
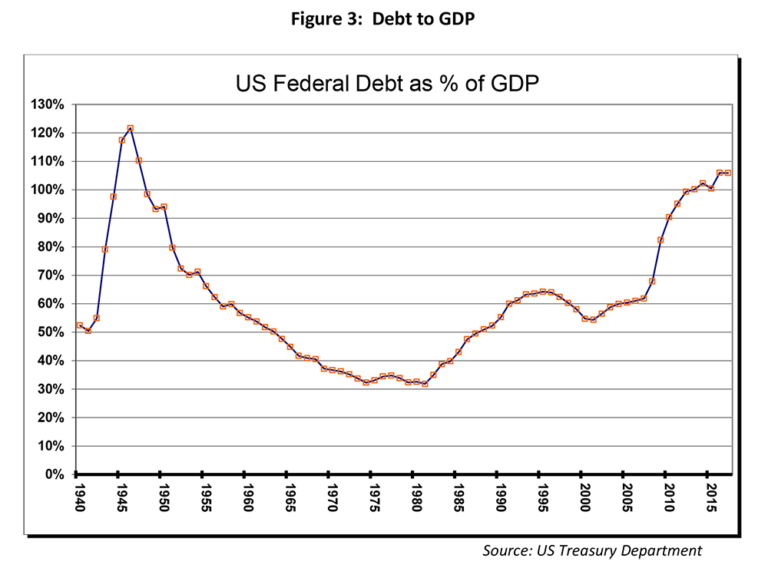
President Trump has come into office promising tax-cuts & more government spending. Some commentators are expecting a reprise of President Reagan’s eight years in office. It is difficult to see how this policy will not widen the budget deficit even further and balloon the debt into more treacherous waters. As of Dec 31, 2016, total federal debt stood at $19.98 Trillion, up from $10.7 Trillion when President Obama took office in 2009. Note this number excludes all off-balance sheet obligations such as future Social Security & Medicare spending. Figure 2 depicts total debt outstanding since 1940. The increase since 2000 has been extraordinary. Debt doubled during President Bush’s eight years in office and then doubled again under President Obama. However, the income to support this debt, nominal GDP, did not rise commensurately. Figure 3 shows debt-to-GDP ratio during the same period. Total debt to GDP was 32% when President Reagan assumed office in 1981. Overall debt levels were not very high when he came to power and he enjoyed the fiscal flexibility to cut taxes but not spending leading to a booming economy. When Bill Clinton assumed the presidency debt-to-GDP was 61% and President Obama inherited a 68% debt-to-GDP fiscal environment.
President Trump, however, faces a very different situation than any of his predecessors in the last 50+ years. Overall debt is now over 100% of GDP and his room for budget maneuverability is therefore substantially reduced. For instance, the government has reduced the interest payments on its debt through a combination of reducing the maturity and the Federal Reserve lowering interest rates. If the interest rate on the debt outstanding jumped up to say 3%, the average rate just prior to the 2008 financial crisis, total interest payments in the Federal Budget would rise to over $600 Billion or 15% of total government outlays, matching spending on Defense or Medicare. Such an increase would choke off government spending in other areas constraining fiscal stimulus. If outstanding debt increases at the same rate as in the prior 16 years then the fiscal trade-offs would be even worse. Given such fiscal constraints, President Trump will have to rely on the private sector to spur growth through reduced regulatory burdens and tax incentives. Private investment, lagging behind during this recovery until now, will have to step in for fiscal stimulus.

CONCLUDING THOUGHTS
Growth is anemic and both investors and the electorate are clamoring for better days as seen by the surprising election of Donald Trump. It remains to be seen if President Trump’s policies will ignite the animal spirits. The market has already run-up in anticipation of good tidings. At Alamar, we will be watching carefully to see if economic momentum is picking up.
Unlike the previous presidents over the last 5 decades, President Trump faces a fiscal vise built up over the last 16 years. Debt-to-GDP is now well over 100% and any increase in interest rates will quickly escalate interest payments on this debt, choking spending in other areas. The President will need to carefully navigate the land-mines to get the economy to hum without further adding to the debt burden.
Thank you for your continued trust and confidence in Alamar Capital Management.
Sincerely,
George Tharakan, CFA
george@alamarcapital.com
Disclosures
The views expressed in this note are as of the date initially published and are subject to change without notice. Alamar has no obligation or duty to update the information contained in this note. Past performance is not an indication of future results. Risk is inherent in investments and involves the possibility of loss.
This publication is made available for informational purposes only and should not be used for any other purpose. In particular, this report should not be construed as a solicitation of an offer to buy or sell any security. Information contained herein was obtained and derived from independent third-party sources. Alamar Capital Management, LLC believes the sources are reliable; however, it cannot guarantee the accuracy of such information and has not independently verified the accuracy or completeness of such information.
This publication, and the information contained herein, may not be copied, reproduced, republished, or posted in whole or in part, in any form or media without the prior written consent of Alamar Capital.