
ACM Commentary 2Q 2017
The first six months of this year have led to repeated new highs for the US stock market and in many other parts of the world. The S&P500 is up roughly 9.3% through the end of June, primarily led by a few well-known names with large weightings in the index.
After almost a decade, the Federal Reserve has finally announced its intention to reduce its balance sheet. This is a momentous decision and needs to be carefully orchestrated to minimize disruptions to the ongoing economic recovery. In the rest of this note, we will discuss the Fed balance sheet and the impact a few names have had on market returns.
FAMAA REVISITED
We first talked about the impact of a few stocks propelling overall market returns in our Q4 2015 writing. Back then we termed these the FAMA stocks, comprising Facebook, Amazon, Microsoft & Alphabet (formerly Google). In this note, we add an additional member, Apple, to this quartet, so now FAMA morphs into FAMAA. These 5 companies now represent almost $3 Trillion in market value or over 12.5% of the S&P500.
To understand the impact of these 5 companies in an index of 500 companies, we need to look at their relative contribution to index returns. In the first half of 2017, FAMAA has contributed roughly 29% of total S&P500 returns. In other words, without these 5 companies, the S&P500 would be up 7.5% instead of 9.3%. A similar pattern holds over longer periods of time. For instance, since the start of 2013, FAMAA represented 31% of total S&P500 returns. The S&P500 is up roughly 15% annualized during this period. Without FAMAA, the index would be up 12.4% annualized.
Such narrow concentration of companies powering overall index returns is a cause for concern. Too many individual and institutional investors have piled into these select few names, pushing prices up further. Passive funds such as ETFs have only exacerbated this phenomenon. As discussed above, FAMAA now represents 12.5% of the S&P500 index and is an even larger 40% of the NASDAQ 100. As investors pour money into passive funds which simply mimic popular indices, the incremental buying concentrates purchases into these select names. Buying begets more buying. Historically when the market was dominated by a select few companies, it typically ended in tears. Determining the precise timing of when the mania ends is, of course, an exercise in futility.
At Alamar, we have stayed away from joining the crowds. We have not, and presently do not, own any of the FAMAA names, albeit to our detriment since these stocks have performed exceptionally well. Despite not being involved in these stocks we have generated good performance, particularly on a risk-adjusted basis. The question before us now is will these stocks continue to power returns as the Fed begins to withdraw the liquidity it has provided over the last decade.
THE FED UNWIND
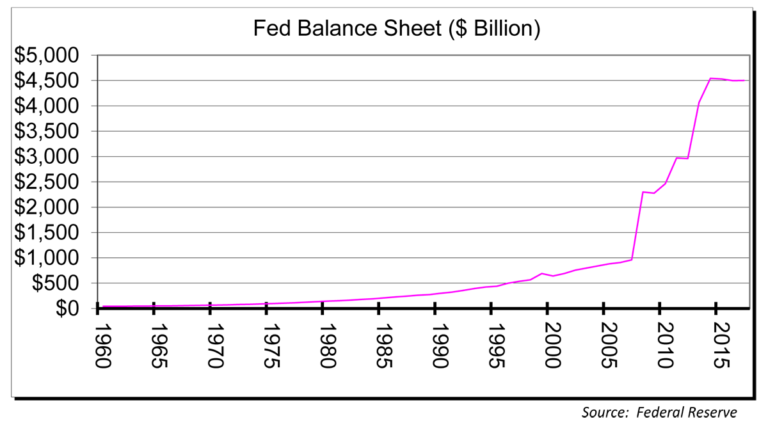
The Federal Reserve, in response to the financial crisis of 2007 and 2008, proceeded to purchase a large amount of securities to stabilize the economy. As depicted in Figure 1, the Fed’s balance sheet exploded from just under $1 Trillion to over $4.5 Trillion in 7 years through four rounds of quantitative easing (QE). Treasuries and Mortgage Backed Securities (MBS) issued by FannieMae & FreddieMac were purchased during this expansion. To lower long-term interest rates the Fed proceeded to purchase securities with extended maturities.
Figure 1: Fed Balance Sheet
The Fed was successful in its efforts to lower both short-term and long-term interest rates but it came at the expense of a large involvement by the central bank in the workings of the economy. Figure 2 shows the size of the balance sheet as a percentage of GDP. Historically, the Fed balance sheet has fluctuated between 5% and 7% of GDP. Through repeated market interventions, the Fed had increased its balance sheet to 26% of GDP by 2014.
Figure 2: Fed Balance Sheet as % of GDP

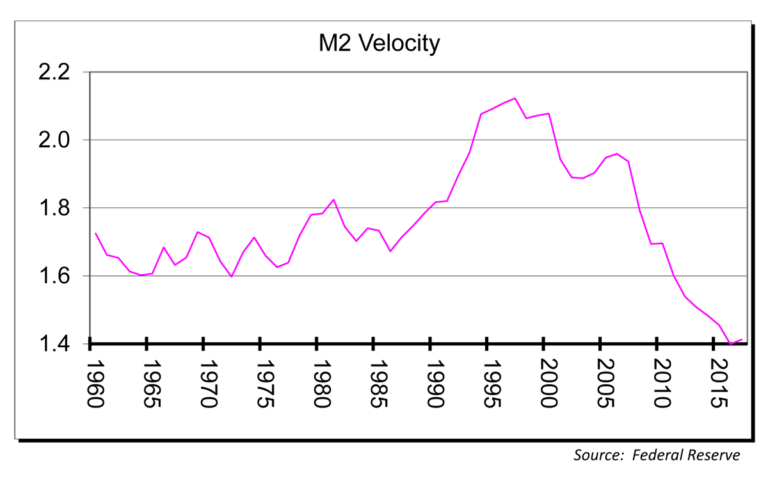
During the 7 years of Fed intervention (2008 – 2014), there has been a widespread concern, shared by us, that this additional liquidity would cause inflation to spike up dramatically. One of the primary lessons of economics is that inflation is caused by more money chasing a fixed amount of goods. No less than Nobel-laureate Milton Friedman had espoused that, “inflation is always and everywhere a monetary phenomenon”. However, to our surprise, the Fed intervention did not result in general inflation. Overall prices of goods and services have not increased more than historic norms. The primary reason for this was the collapse in money velocity. Figure 3 plots the velocity of money since 1960. M2 velocity was close to 2.0 at the end of 2007 and has now dropped 30% to a low of 1.4. The money pumped by the Federal Reserve typically percolates into the economy through banks in the form of loans. Unfortunately, bank lending has been anemic throughout this recovery and consequently velocity has fallen. For instance, Bank of America had $876 Billion in loans at the end of 2007 which has grown to $923 Billion at the end of June 2017, a pedestrian growth of 5% over 10 years! Total lending growth from all the banks we follow has decreased from a middling 4% last year to an even lower 2% this year. It is difficult to see how inflation can pick up under such circumstances.
Figure 3: M2 Velocity
After a decade of monetary experimentation with questionable results, the Fed has recently announced a plan to withdraw the stimulus and shrink its balance sheet to an undefined level starting later this year. In our view, withdrawing the punch bowl will prove just as tricky, if not more so, as providing it. The Fed will have to undertake this experiment in an environment of already low inflation and excessive debt economy-wide. If it withdraws too quickly, it risks sending the economy into a catastrophic deflationary spiral. Conversely, doing nothing simply prolongs the inevitable adjustment that must be made. By our calculations, withdrawing the stimulus over a period of seven years (the same timeframe as the balance sheet expansion) to get back to a balance sheet of similar proportions as 2007, would require an annual decline of 14% in assets held by the Fed. At the end of the decline in 2024, the Fed would hold roughly $1.6 Trillion in assets. The shrinkage rate can be lower if the period is extended beyond 7 years.
There is concern in some quarters that the Fed stimulus, in lieu of inducing inflation and wage growth, has juiced the asset markets such as stocks and real-estate. If such concerns prove on the mark then a withdrawal of stimulus could potentially disrupt the asset markets, particularly popular names such as FAMAA. Our crystal ball is too cloudy to make such assertions.
CONCLUDING THOUGHTS
The stock market, particularly over the last five years, has been dominated by the performance of a select few names. Just 1% of the stocks in the S&P500, the Fab 5 (FAMAA), have generated 31% of the returns. Such a performance cannot continue indefinitely and a reckoning is to be expected at some point. At Alamar, we have avoided these names due to their overwhelming popularity, albeit to our detriment.
The Federal Reserve has finally announced the unwinding of their decade-long monetary experiment. Given the prevailing economic environment, the Fed will need to be very careful – checking out may prove to be more arduous than checking in. It remains to be seen if FAMAA will suffer from any withdrawal symptoms.
Thank you for your continued trust and confidence in Alamar Capital Management.
Sincerely,
George Tharakan, CFA
george@alamarcapital.com
Disclosures
The views expressed in this note are as of the date initially published and are subject to change without notice. Alamar has no obligation or duty to update the information contained in this note. Past performance is not an indication of future results. Risk is inherent in investments and involves the possibility of loss.
This publication is made available for informational purposes only and should not be used for any other purpose. This report should not be construed as a solicitation of an offer to buy or sell any security. Information contained herein was obtained and derived from independent third-party sources. Alamar Capital Management, LLC believes the sources are reliable; however, it cannot guarantee the accuracy of such information and has not independently verified the accuracy or completeness of such information.
This publication, and the information contained herein, may not be copied, reproduced, republished, or posted in whole or in part, in any form or media without the prior written consent of Alamar Capital.