
ACM Commentary 4Q 2013
The year 2013 will go down as one of the best years for equity investing. Despite all the dysfunction in Congress and the possibility of tapering by the Federal Reserve (taper tantrums), the S&P500 ended the year up over 32%! At Alamar, despite holding high levels of cash
through most of the year, we took advantage of the opportunities presented and did quite well. Our results for last year and since inception in 2010 are shown below. We have been exceptionally fortunate in the timing of our inception. A client who joined us 4 years ago has now well more than doubled his or her investment. Replicating these results going forward will be extraordinarily difficult, almost as difficult as the Federal Reserve’s task to unwind their bloated balance sheet.

Given the phenomenal returns of 2013, we will look at historical market returns in this writing to put last year in context. We will also provide an update on the economy to see where we are in the present recovery.
HISTORICAL EQUITY RETURNS & PROFITS
With a great year in the rear-view mirror, we looked at past returns to determine the frequency of such bounty. We used the S&P500 as a proxy for the overall US equity market and obtained returns stretching back to 1926. The S&P500 has returned 10% annually since then on a compounded basis. Needless to say the journey over the last 88 years has not been smooth sailing. Volatility of these returns, as measured by standard deviation, has been 20%. Said differently, returns typically fall between a loss of 10% and a gain of 30%.
Figure 1 shows the frequency of annual returns of the S&P500 since 1926. As can be seen from the figure, returns are quite evenly distributed around the 10 – 20% return band. A drop of more than 30%, such as 2008, and conversely, a gain of more than 40% are very rare. Years like 2013, with a gain of more than 30%, have odds of roughly one in six.
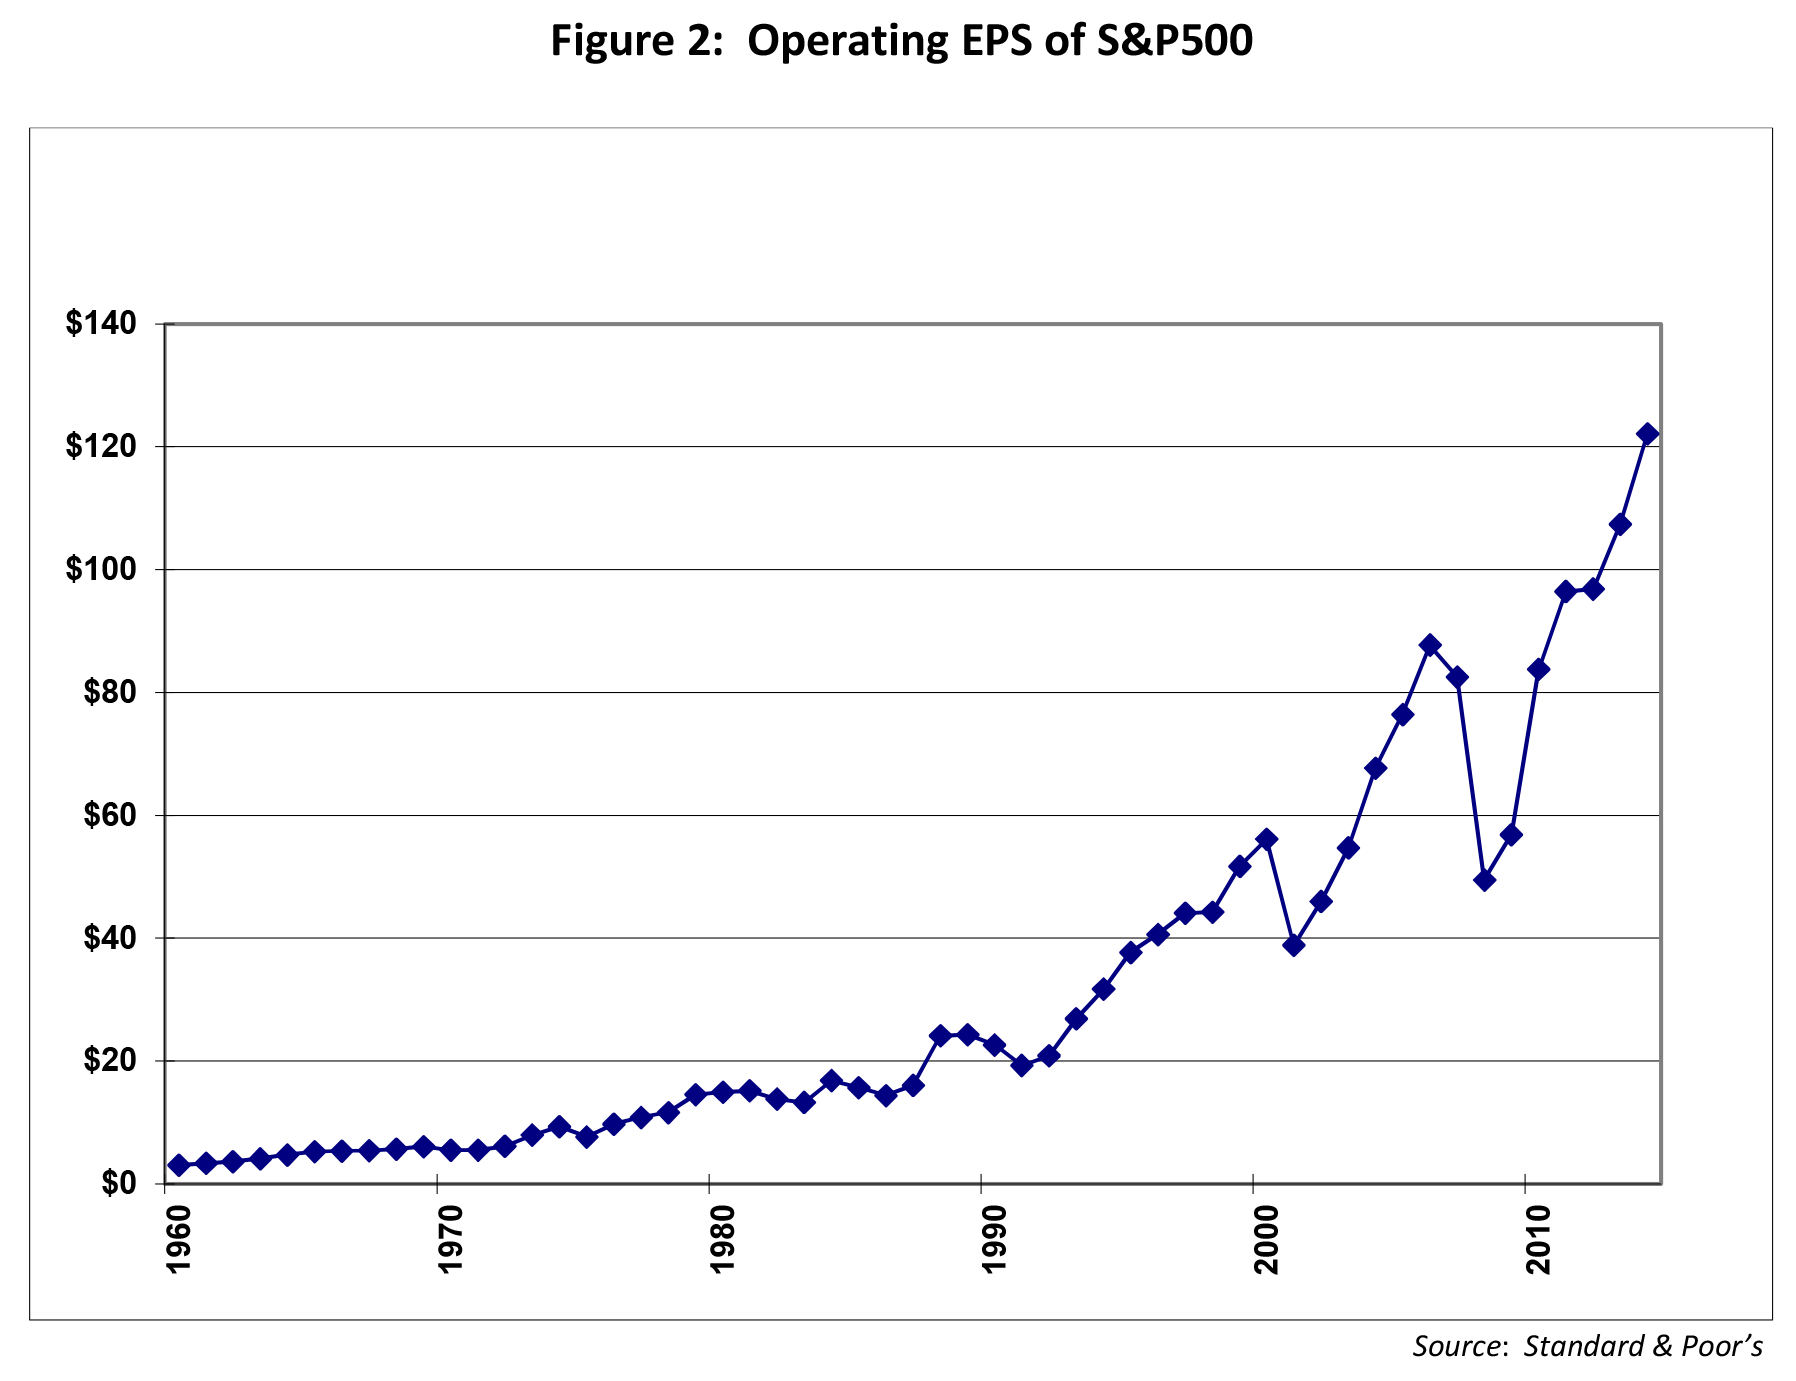
While great returns are fun, it is important to ensure that corporate profits are keeping pace with those returns, otherwise the risk of a market correction rises. At Alamar, we keep track of the profit growth of the market and especially of our investments. Figure 2 depicts the operating profit of the S&P500 holdings over the last five decades. As can be seen profits have substantially exceeded the prior peak set in 2006, before the onset of the Great Recession. Operating earnings per share (EPS) is expected to grow 11% in 2013 to $107.4 and another 13.7% in 2014 to $122.11. Clearly, returns have far exceeded profit growth implying price-to-earnings (P/E) multiples have expanded as the year progressed. The P/E multiple now stands at 15x, right in line with the long-term average. As a point of comparison, the earnings of our equity portfolio in the most recent reported quarter (Q3 2013) grew almost 20% compared to 12% for the S&P500. For the just ended quarter (Q4 2013) earnings for our portfolio are expected to grow over 25% compared to 21% for the S&P500. At these rates of profit growth, a P/E multiple of 15 is easily justified.

MONEY FLOWS
Despite the robust returns of US stocks since we began operations in 2010, investors have not clamored to join in on the action. Skepticism continues to reign about the current economic recovery. Table 1 below shows the flows into domestic equity funds and ETFs over the last 4 years. We estimate the ETF flows by calculating the flows into the largest domestic ETFs.

Clearly, investors have not bought into this rally as seen by the significant outflows. Amongst the explanations given for the wariness include, in no particular order:
The Federal Reserve is inducing the market to go up. Once the printing stops, the party will end.
Tapering by the Fed will lead to a rise in long-term rates which will in turn cause a hiccup in the stock market.
Another Great Recession is around the corner so it’s best to park savings in cash, safe bonds and gold.
Raising taxes (in 2013), government shutdowns, congressional gridlock, sequestration etc.
Affordable Care Act (Obamacare) will put the kibosh on employment growth
We did not buy into these dooms-day scenarios when we started Alamar as the recovery began and we do not agree with these sentiments now. As Warren Buffet has said “you pay a high price for a cheery consensus”. The price paid for sitting out this recovery, waiting for the dust to settle, has been high indeed.
THE ECONOMIC RECOVERY
In past writings we have depicted employment indicators to show that the current economic recovery remains on track. We will not repeat the metric this time but state that an updated graph of jobs created in this recovery is very similar to the trend seen in the previous recovery (2003). Instead of jobs we will look at consumer spending, representing two-thirds of the economy. A useful metric we track is the total spending on credit and debit cards as reported by the major card networks (Visa, MasterCard and American Express). Figure 3 depicts annualized US spending as measured by these companies.

As seen above, the spending pattern clearly shows the impact of the Great Recession in 2008/2009 and the upturn since then. US consumer spending is now 25% above the previous peak and the recovery remains on track.
CONCLUDING THOUGHTS
The economic recovery continues and the equity markets are anticipating a strengthening recovery as reflected in the robust 2013 returns. Investors, however, are not believers in this new bull market as seen by persistent outflows from domestic stock funds. Late last year there was a change in this trend when outflows abated and inflows rose moderately. It remains to be seen if this reflects a fundamental change in investor sentiment.
While replicating 20% plus annual returns will be difficult, we do believe more moderate returns are achievable over the next few years.
We wish everyone a prosperous 2014! Thank you for your continued trust and confidence in Alamar Capital Management.
Sincerely,
George Tharakan, CFA
george@alamarcapital.com
John Murphy, CFA
john@alamarcapital.com
Disclosures
The views expressed in this note are as of the date initially published and are subject to change without notice. Alamar has no obligation or duty to update the information contained in this note. Past performance is not an indication of future results. Risk is inherent in investments and involves the possibility of loss.
This publication is made available for informational purposes only and should not be used for any other purpose. In particular, this report should not be construed as a solicitation of an offer to buy or sell any security. Information contained herein was obtained and derived from independent third-party sources. Alamar Capital Management, LLC believes the sources are reliable; however, it cannot guarantee the accuracy of such information and has not independently verified the accuracy or completeness of such information.
This publication, and the information contained herein, may not be copied, reproduced, republished, or posted in whole or in part, in any form or media without the prior written consent of Alamar Capital.