
ACM Commentary 2Q 2018
Despite good earnings fundamentals, the S&P500 is up only 2.6% through the end of the 1st half, probably due to fears of rising rates and possible trade wars. As in prior years, most of the gains have come from the FAMAA (Facebook, Amazon, Microsoft, Apple and Alphabet) stocks. Without these Fab5 the S&P500 would be barely up for the year. Despite never investing in FAMAA stocks our investments have performed well. In fact 16 of the 42 stocks we own, roughly 40% of the portfolio, have more than doubled since we first purchased them. Some of these have tripled or quadrupled and the best performer is now a 16-bagger. None of these investments experienced a smooth ride after we invested in them. Over the years there were numerous large share price declines due to earnings misses and lowered growth expectations. These stocks are not isolated to a particular sector but spread across the consumer, financial, healthcare, energy and technology sectors. We hope the remaining 26 stocks catch up with their brethren over time.
From our vantage point the largest impediments to the market moving forward are: rising interest rates, narrowing spreads and trade wars. In this note, due to space constraints, we will address the issues dealing with interest rates. We postpone trade tensions to another discussion except to note that if there was ever a time to correct trade imbalances through penalties, it is at the present moment whilst the US economy is on an impressive upturn.
WHAT DO NARROWING SPREADS PORTEND?
Investors are presently very focused on the term-structure of interest rates. The term-structure defines the interest rate demanded by the market at various maturities. Typically, US Treasury yields are used as a representation of the term-structure. Yields at various maturity dates – 3 months, 1 year, 2, 5, 10 & 30 years are plotted on a curve. Most of the time the yield curve slopes upwards – 10 year yields are higher than 5 year bonds and 5 is larger than 2 year maturities and so on. An upward sloping curve signifies a growing economy and/or higher inflationary expectations in the future. Conversely, an inverted yield curve, where long-term rates are lower than short-term rates, portends trouble down the road. Since the Federal Reserve has a significant influence on the very short-end of the curve through the Federal Funds rate, investors focus on the intermediate to the longer end of the curve which is primarily set by market participants. In particular, investors focus on the 2-year and longer maturity yields.
Figure 1 plots the Treasury yield curve at the end of the second quarter. Notice that the curve is sloping upwards from the 1 month maturity to about 3 years. After 3 years the curve begins to flatten considerably such that the yield at a 30 year maturity (2.98%) is not much more than the yield at a 3 year maturity (2.63%). Such a flattening of the curve is a problem for institutions that invest in long-maturity securities such as insurance companies and pension plans. Investors are not being paid to invest in longer maturity securities.
Figure 1: Treasury yield curve on June 29, 2018
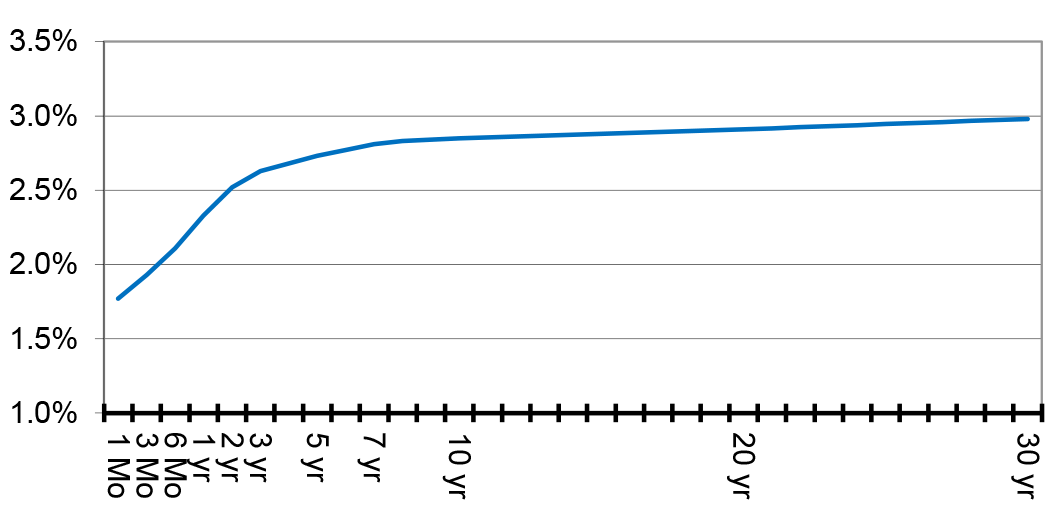
Source: US Treasury
The primary concern from an equity investor’s viewpoint: does the flattening curve signify problems down the road? Historically, one of the best indicators of an oncoming recession is an inverted yield curve. However, this indicator is not a perfect predictor and certainly the timing is frequently off. To understand why this is the case we have plotted the difference or spread between the 10-year and 2-year yields over the last 50 years in Figure 2.
As you can see, the line dips below 0% (the curve is inverted) when the economy is typically in a recession as was the case in 1973, 1980, 1990 and 2001. However, the timing is never optimal. For example, the curve began to drop in 1997, a full 4 years before the actual recession in 2001. If investors had sold equities and gone to cash in 1997, in response to the declining spreads, they would have missed out on very large gains over the next 3 years. Similarly the curve briefly dropped into negative territory in 2006 well before the recession in 2008. Indeed by 2008 the curve was already deep into positive territory reflecting a steep yield curve. Getting fully invested in 2008 would have considerably lightened investor pockets! The 2-10 year spread currently (0.31%) is similar to the environment in 1997 and 2005. As you may recall, both of those prior periods provided wonderful investing backdrops. Looking at the numerous indicators we track, we do not currently foresee a recession on the near horizon.
Figure 2: 2-year/10-year Treasury yield spreads

Source: US Treasury
IS RISING RATES A HEADWIND FOR THE MARKETS?
Besides narrowing spreads, another issue that concerns investors presently is the rise in interest rates. Note that the rise in rates has been concentrated in the front-end of the maturity curve. The 2-year interest rate for example has gone from less than 0.50% in 2011 to over 2.5% now. However, the long-term rates, such as the 10-year maturity, have barely budged. In 2011 the 10-year rate averaged 2.78%, not much different from the 2.8% now.
Since equity is the ultimate long-term investment (there is no maturity for a stock), investors typically discount cash-flows using the 10-year treasury as a benchmark and adding an equity risk premium. Indeed a regression of the price-to-earnings (P/E) multiple of the market to the 10-year Treasury rate shows a meaningful correlation. We ran regressions of both the trailing P/E (price to trailing earnings) and forward P/E (price to forecast earnings) and the results were much stronger for the trailing P/E regression.
Figure 3 plots the regression of the trailing P/E of the S&P500 to the 10-year treasury yield. The graph plots P/E to yields since 1960 covering inflationary periods, disinflationary times, recessions and expansions. While there are many variables that go into calculating the value of the stock market, the 10-year rate explains roughly 1/3 of the variation. Care must be taken to not put too much emphasis on a single factor as the figure clearly shows that P/E multiples deviate significantly from values predicted by the regression model. Nevertheless, the model does follow what economics teaches us – high interest rates are a headwind for the markets as shown by the negative sign for the interest rate coefficient. Indeed the model provides a simple estimation of the trailing P/E for any given interest rate. For instance, if the 10-year rate is at 4%, the model predicts the trailing P/E should be 22.6 – 4% = 18.6. Given the current 10-year rate at 2.82% the model predicts a trailing P/E of 19.8. If we use 2017 earnings as the trailing number we get a price for the S&P500 of 2,465. If we use 2018 earnings instead, we get 3,125. As of this writing the S&P500 happens to be roughly at the midpoint of the two targets!
Figure 3: Trailing P/E to 10 year Treasury yield

Source: S & P, Alamar calculations
Notice the predicted P/E above is very different from the Shiller CAPE (cyclically adjusted P/E). The Shiller CAPE does not use the 10-year rate or any interest rate for that matter. It simply averages the prior 10 years of inflation-adjusted earnings to make an estimate. On that basis the market is much overvalued currently as the CAPE shows a P/E of 32.
CONCLUDING THOUGHTS
Investors are rightfully focused on the narrowing interest rate spreads as a harbinger of oncoming recession. While we remain vigilant of this signal, we do not presently see any signs of economic slowdown. Historically, markets have continued to power forward for many years after the first signs of a narrowing spread. Investors getting out of the stock market at the first sign of tightening spreads would have missed out on large gains.
Another investor concern is rising interest rates, especially at the short-end. Our analysis shows that with present 10-year rates and levels of corporate profits, the S&P500 is reasonably valued. Higher rates could pose a headwind going forward.
We continue to find solid opportunities that meet our investment criteria – well managed companies with good growth trading at reasonable valuations. Forty percent of our investments have already done spectacularly well since we invested in them and we hope the others will follow.
Thank you for your continued trust and confidence in Alamar Capital Management.
Sincerely,
George Tharakan, CFA
george@alamarcapital.com
Disclosures
The views expressed in this note are as of the date initially published and are subject to change without notice. Alamar has no obligation or duty to update the information contained in this note. Past performance is not an indication of future results. Risk is inherent in investments and involves the possibility of loss.
This publication is made available for informational purposes only and should not be used for any other purpose. In particular, this report should not be construed as a solicitation of an offer to buy or sell any security. Information contained herein was obtained and derived from independent third-party sources. Alamar Capital Management, LLC believes the sources are reliable; however, it cannot guarantee the accuracy of such information and has not independently verified the accuracy or completeness of such information.
This publication, and the information contained herein, may not be copied, reproduced, republished, or posted in whole or in part, in any form or media without the prior written consent of Alamar Capital.