
ACM Commentary 1Q 2020
MARKET COMMENTARY
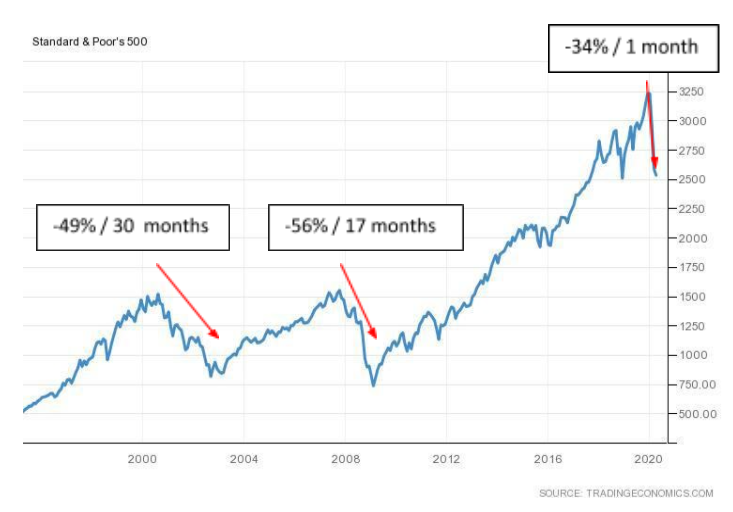
It is hard to fathom that just 6 weeks ago, on February 19th, the U.S. stock market reached an all-time high when S&P closed at a record 3,386. Of course, a lot has transpired in the weeks since, leaving most of us sheltered in our homes, dealing with the simultaneous health worry associated with the Coronavirus, as well as its financial impact. Additionally, we have voluntarily shuttered the economy, a very large and slow-moving ship, to attempt to mitigate the impact of the virus. This combination makes our current crisis akin to a war, which is why the recent correction is different than the great recession, or dot com bubble, and why we find ourselves in such unchartered waters. None of us have lived through anything like this before, and if the market dislikes anything, it is uncertainty. Understandably, the markets have experienced near unprecedented volatility in the days since, as investors have grown increasingly aware of the size and the scope of the challenge before us. The market has fallen in a matter of days and weeks in an amount that typically has taken months and even years in prior bear markets. In fact, the current correction, rivals only the market crash of 1987 when it was down -31% in just 14 days. However, it has been said that the first victim of a crisis is perspective, so it is also important and instructive to look at the gains in the market over the past decade, particularly considering the alternatives like cash.
Much of the data necessary to measure the virus’ impact on the economy, as well as our investment positions is still unknown. With each passing day, more companies remove future guidance on the performance of their businesses as a result of the Coronavirus. Additionally, as we do get into first quarter earnings season this week, as January and February did not reflect the pandemic crisis, it is only the month of March that will help inform the economic damage caused.
What we do know now, is that the market’s reaction to the Coronavirus and subsequent shut down of the economy has been both violent and indiscriminate. Down -19.6% the S&P experienced its worst quarterly return since 1938. A traditional 60/40* allocation provided a bit of ballast to returns generating a loss of -12.6% in the quarter. Other than government bonds and cash, there was nowhere to hide from the market’s turmoil. Spreads widened causing proportional losses across the fixed income risk spectrum, and even traditionally defensive sectors like utilities, staples, and health care saw meaningful losses. The energy sector, for its part, was down -51% in the quarter. A victim of a double whammy of a massive reduction of demand as the economy was halted, and a huge influx of supply as both Saudi Arabia and Russia engaged in a price war and flooded the market.
As for Alamar, our stock portfolio fared better than the broader markets with our equity portfolio posting a -18.6% return for the quarter. In response to the crisis, we have rebalanced our stock portfolio to free up cash and to help us handicap against the uncertainty of COVID and the possibility of policy response errors.
On the Alamar Wealth front, we have been taking advantage selectively in taxable accounts to harvest losses and replace with like positions. We foresee slowly working towards rebalancing accounts back to target risk levels, where appropriate, overtime. However, hard earned lessons from prior market corrections have taught us that there are often a few false starts before a sustained recovery. Of course, time will tell.
Equally dramatic as the recent market volatility, has been the monetary response from the Federal Reserve and the fiscal response by the Senate to the crisis which has been similarly dramatic and unprecedented. In response to the pandemic and in reaction to the stay at home orders shuttering the economy, the Fed has stepped in to offer near limitless and in some cases unprecedented resources to act as a lifeline to support the credit markets and businesses. The Fed’s response has been extensive and will have eventual repercussions. We will discuss it in greater detail in a future commentary. A good summary on their actions can be found here.
To head off the damage, and in an encouraging bipartisan fashion, Congress has responded with three legislative actions, or phases. First, on March 6th it passed a bill providing $8.3 billion in support of U.S. public health to assist with the development of vaccines and additional medical supplies and resources. Second, on March 10th the Families First Coronavirus Response Act was passed to provide relief for both employers and employees who were affected by COVID-19. This legislation is intended to directly combat the virus and cushion those affected by funding sorely needed additional testing, funding sick leave for many workers, and providing funds to states via Medicaid funds. Phase three of the legislative response was enacted on March 27th with the passage of the Coronavirus Aid, Relief and Economic Security Act (CARES). At an expected cost of $2.2 trillion, or 10% of US GDP, it is structured as a bailout and stimulus package to aid industries suffering from the pandemic and provide economic relief to families and small businesses who are suffering. Specifically, the bill authorizes emergency loans to distressed businesses and provides funding for forgivable bridge loans. The bill also provides funding for $1,200 tax rebates to individuals, with additional $500 payments per qualifying child. The rebate begins phasing out when incomes exceed $150,000 for joint filers. Additionally, the legislation suspends federal student loan payments. In a further backstop the bill authorizes the Department of the Treasury to temporarily guarantee money market funds. With the House and Senate now both adjourned, discussions are already underway on both sides of the aisle about the need for an additional Phase 4 of stimulus.
It has been estimated that the combined response totals as much as $4 trillion in stimulus (20% of GDP). The offsetting impact of both monetary and fiscal policy efforts to support the economy is currently unknown, as it is difficult to project how much of the stimulus gets to the underlying economy. Once there, it is equally difficult to predict the extent to which it will dampen the blow of the temporarily shut down. Current projections for the US Economy expect a contraction of 25-35% in GDP in the second quarter, with some anticipating an expansion of as much as 19% by the 3rd quarter. While there is a risk that we remain closed longer than anticipated, and a longer-term fallout on income and spending persists, the aggressive action by the Fed and government has surely helped to contain this. The stock markets recovery in the later part of March and into April (+20%) reflects this.
At Alamar our crystal ball is blurry, and we are not particularly good at reading the tea leaves. Though, like you, we have been reading everything we can get our hands on about the virus. We are less inclined to try to trade our portfolio to market time the peak number of cases of COVID-19. Nor are we interested in identifying stocks that might in the short term see a tail wind from the crisis. Our experience has taught us that a crisis is not a good time to experiment with your skill set. We remain focused on the long term and identifying businesses that we can own for several years down the road.
However, no investor is immune from the challenge that the Coronavirus presents because it has fundamentally changed our understanding of the world in which we live. Consumer behavior will likely change due to the economic impact, as well as our concern for our physical safety – at least for a period. Businesses will be forced to respond and not everyone can be saved; those companies that have the strongest balance sheets carry with them considerable advantages over their more cash strapped peers.
At Alamar, we are hard at work addressing these issues, particularly as they apply to our portfolio of investments, and when looking at alternatives. Where there is more uncertainty, we must increase our margin for error. Likewise, the market’s correction has allowed us to identify and invest in companies that we have admired for many years at very attractive prices. Fortunately for us, we believe this type of analysis is much easier to perform at a more granular level, one company at a time, as opposed to through the ownership of an index. We strongly believe that opportunity will continue to present itself in the weeks and months ahead, but of course much uncertainty remains. Considering your own personal investment time horizon and risk tolerance level is never a bad idea, and something that we encourage.
COVID SUMMARY
Of course, in time we will prevail and overcome this crisis. American ingenuity is hard at work. It is just a question of how long it will take to secure more testing, immunotherapy treatments and eventually a vaccine. In the meantime, we have learned that we can buy more time for ourselves and reduce the burden on our healthcare system with the only current arrow in our quiver – social distancing. These efforts appear to be working to “flatten the curve”, as new cases have begun to decelerate where it has been practiced. In the U.S., this has resulted in the Institute for Health Metrics and Evaluation to reduce their guidance for deaths twice this week alone and now project 31,000 to 127,000 deaths. Though still tragic, this is a much lower figure than their original projections.
With a reopened economy we will then gain an understanding of the degree of the damage, and the extent to which habits have been changed. With the benefit of hindsight, the U.S. and greater Europe have been slow to respond to the COVID-19 pandemic, and we are paying the very real consequences. Surely, we will come out of this challenge with more resolve and much better prepared and more informed to combat future viruses. The graph below, provided by Our World in Data, displays a view of the effectiveness of the global response to the virus to date. It depicts the growth of the virus in each country upon confirmation of the 100th case.

The United States is the red line above France, and unfortunately does not fit on the chart. We currently have the most Coronavirus cases in the world, with over 600,000 as of this writing. Contrast this with Asia’s Coronavirus response, where countries like South Korea, who reported their first case on the same day as the United States, is being held out as a model for early action and aggressive containment. Both were hard hit by the SARS epidemic in 2003, and their leaders vowed to build up national capabilities and regional coordination to respond rapidly and effectively to future pandemics. Subsequent outbreaks of H5N1 and H1N1 avian influenza reinforced their focus on pandemic preparedness. As you can see, many Asian countries who intervened quickly have already seen their curves flatten. Italy, a global hotspot provides a glimmer of hope. Another late adopter to containment efforts, they are beginning to show some signs of improvement for their efforts, as their daily number of new cases seems to be slowing.
The next chart from the same source shows the much talked about testing effort. Again, South Korea has proven very quick to react and Italy has done an admirable job escalating their efforts.

Fortunately for the U.S., these countries with both prior experiences dealing with earlier virus epidemics and who are further along the curve dealing with this crisis provide a reference point. We would be wise to leverage their experiences and best practices to our benefit.
We hope this email finds you safe and sound and enjoying some newfound time with your families.
Thank you for your time and continued consideration –
John Murphy, CFA
Perhaps, some useful resources:
Harvard Business Review / Lessons from Italy’s Response
The Institute for Health Metrics and Evaluation (IHME) Projections
Our World in Data Trusted Resource
DISCLOSURES
The views expressed in this note are as of the date initially published and are subject to change without notice. Alamar has no obligation or duty to update the information contained in this note. Past performance is not an indication of future results. Risk is inherent in investments and involves the possibility of loss. Net of fee performance is calculated using the highest fee. The Russell 3000 Index measures the performance of the largest 3000 U.S. companies representing approximately 98% of the investable U.S. equity market. The S&P 500 Index, which is a market-capitalization weighted index containing the 500 most widely held companies chosen with respect to market size, liquidity, and industry.
This publication is made available for informational purposes only and should not be used for any other purpose. This report should not be construed as a solicitation of an offer to buy or sell any security. Information contained herein was obtained and derived from independent third-party sources. Alamar Capital Management, LLC believes the sources are reliable; however, it cannot guarantee the accuracy of such information and has not independently verified the accuracy or completeness of such information.