
ACM Commentary 4Q 2021
From all of us at Alamar Capital, we wish you a happy and safe new year! Despite the prevalence of COVID throughout last year and the resurgence of the latest variant Omicron, corporate profits surged far beyond expectations. At this time last year consensus forecasts for S&P 500 operating earnings for 2021 were expected to be $165. Instead, actual earnings for 2021 are now expected to be $202, a full 22% above expectations!
After a great 2020, our equity portfolio returns moderated last year. Alamar’s equity portfolio was up 15.1% while the S&P500 was up 28.7%. Some of our large, long-term investments, after doing extremely well in 2020, did not repeat the performance in 2021. Since starting in 2010 our equity portfolio is up 15.8% annualized while the S&P500 grew 15.2%. Once again, the S&P500 was led by the large, well-known stocks (FAMAA plus Tesla and Nvidia). As discussed in prior writings, we don’t own any of these stocks. We expect the law of large numbers to eventually catch up with these stocks, though our expectation has yet to come to fruition.
We expected the economy to boom in 2021 and that is how it played out. We anticipate the economy to once again grow this year, but not at the torrid pace of last year. Corporate cash flows are at all-time highs, margins have never been this strong and tax rates so low. As a result, we expect a renaissance in business capital spending and share buybacks. We will also provide our updated view on the latest COVID surge.
CORPORATE PROFITABILITY
Regardless of the disruptions caused by COVID, last year was remarkable for corporate profitability. Reading the headlines of rapid inflation, wage increases, supply chain disruptions and shortages of everything, one would expect a drop in profit margins, if not profit levels. However, that is not how it played out when you analyze corporate financial statements. In fact, 2021 was one for the record books as far as profit margins were concerned.
Figure 1 plots corporate free cash flow as a percent of US GDP since 1950. We define free cash flow as operating cash flow minus capital expenditures. The average free cash flow margin over the last 70 years has been roughly 2%. However, last year the margin was over 6%, a feat never before seen. This was achieved despite companies not scrimping on capital expenditures (capex). Capital spending was 9.4% of GDP last year, right in line with long-term averages. Because profitability shot through the roof, cash flows followed.

The question we ponder … is this a fluke or the start of a trend? Look at Figure 1 closely and you’ll notice free cash flow rose above the 2% average in 2003 and has never dropped below since. One reason, we speculate, is the changing mix of US corporate profits. The economy now is very different from the 1950s or even 20 years ago. Overall profits now are driven by extremely profitable companies in the software and semiconductor sectors. Looking at long-term averages will obfuscate the remarkable shift taking place. As a result, expecting margins to revert back to mean will be an exercise in futility. As an example, one of our investments, a large software company, has improved its operating margins from 35% in 2010 to over 45% in 2021. As software eats the world, overall margins arithmetically improve.
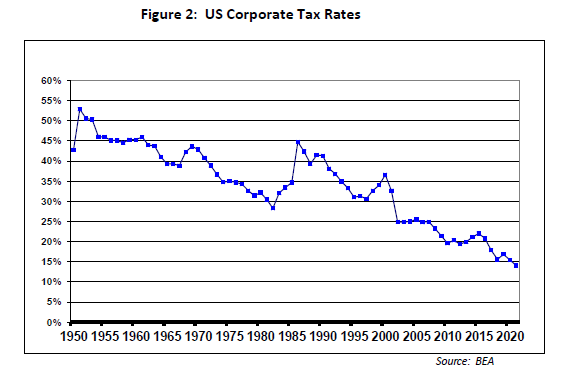
Another long-term trend is a decline in corporate tax rates. Figure 2 depicts overall tax rates for US companies since 1950. Tax rates have been on a long-term decline since 1986, through both Democratic and Republican administrations. Overall rates are now 15% or less, very competitive with the rest of the world. Note we are showing what companies actually pay in taxes, not what they report in their financial statements.
A record-high free cash flow margin, combined with a record low tax rate should, in our view, spur a capital spending boom. COVID has taught us the importance of short, predictable and nearby supply chains. Having a factory in China to supply essential goods such as masks, ventilators and cars is a recipe for lost sales and customer frustration. A shutdown of an entire Chinese city for weeks due to a single case of COVID will quickly ripple across the entire world if essential supplies are manufactured in or transit through that city. The port congestion in Los Angeles and Long Beach, now over 6 months and counting, is a strong signal to companies to revisit and rearchitect their supply chains. Having factories in North America could have prevented this mess.
Indeed, we are starting to see initial signs of this shift. Ford and SK announced an $11.4 Billion investment in a new factory complex to manufacture cars and batteries. GM, Toyota, Volkswagen and Rivian have all announced plans for new factories as well. In semiconductors, Intel has begun work on 2 new fabrication plants in Arizona, Samsung will start a new plant in Texas, TSMC in Arizona and Texas Instruments is building 2 new plants after completing another this year.
COVID UPDATE
Unfortunately, we are still dealing with the COVID virus, more than 2 years after its emergence. We seem to be in a battle with the virus as it adapts to the latest vaccines deployed to eliminate it. The latest variant, Omicron, has over 30 mutations on its spike protein, which it uses to enter human cells rapidly. As a result, this variant is far more transmissible than the prior variant, Delta. The good news, however, is the infection seems far less severe compared to prior variants. The table below shows some statistics from a large hospital system (> 10,000 beds) in South Africa where omicron was first identified. South Africa has experienced 3 COVID-19 waves: (1) June to August 2020 (ancestral variant), (2) November 2020 to January 2021 (Beta), and (3) May to September 2021 (Delta). Cases again started to increase beginning November 15, 2021, coinciding with the identification of Omicron; as of December 7, the date this study was completed, 26% test positivity rates were observed.
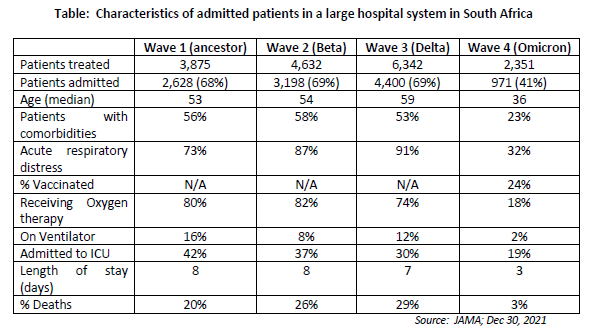
As can be seen from the South African data, severity of Omicron is substantially less compared to Delta – 18% needed oxygen compared to 74%, 2% on ventilator compared to 12% and far fewer deaths. One important caveat is that the population entering the hospital in this wave was younger compared to prior waves (mid 30s versus mid 50s). We are hopeful that this pandemic is slowly burning itself out as both humans and the virus adapts to changed circumstances so that eventually it becomes an endemic disease, similar to past viral infections.
OUTLOOK FOR 2022
We expect the economy to grow well again this year. Tailwinds include:
Low-interest rates across the yield curve facilitates investment boom
Large fiscal deficits continue as the 2021 Infrastructure Act gets implemented
Very strong US consumer with low unemployment, strong wage growth and high savings
Record corporate free cash flow triggers large stock buybacks, acquisitions and investments
However, there are some headwinds developing which we are monitoring and have spoken about in prior notes:
Inflation is picking up, triggering a Fed response to raise rates
US dollar is stronger vis-à-vis the Euro and the Yen which may slow exports
A resurgence of COVID variants reinfecting vaccinated individuals disrupting production
Labor & supply shortages in select industries
We expect the market to be more volatile this year as investors adjust portfolios in response to Fed rate increases. Two of our investments were acquired last year. We expect more mergers & acquisitions this year driven by easy financing and record cash flows. Since we invest in growing, well managed companies trading at reasonable valuations, some of our holdings may continue to receive bids in this environment. Two of our investments have recently attracted large activist shareholders agitating for change.
CONCLUDING THOUGHTS
The characteristics of business are changing dramatically as we speak. The penetration of software, automation, machine learning (ML) and artificial intelligence (AI) is dramatically reshaping the economics of business. Companies are getting far more efficient and their competitive advantage is proving more durable. As a consequence, profit margins and free cash flows are at record levels. Coupled with low-interest rates and corporate taxation, the stage is set for a robust growth environment.
We prospect in companies that do not typically garner the headlines or are the topic of cocktail conversations. Apple Inc, for instance, is valued at almost $3 Trillion and represents roughly 7% of the S&P 500. Revenues are expected to grow 5% this year and next. Can this stock double over the next 5 years? That would be a stupendous achievement, something we are very doubtful could be accomplished. Instead, we invest in companies that are valued in the billions, where the hurdle to double in 5 years is much lower and growth prospects stronger.
Thank you for your continued trust and confidence in Alamar Capital Management.
Sincerely,
George Tharakan, CFA
DISCLOSURES
The views expressed in this note are as of the date initially published and are subject to change without notice. Alamar has no obligation or duty to update the information contained in this note. Past performance is not an indication of future results. Risk is inherent in investments and involves the possibility of loss.
This publication is made available for informational purposes only and should not be used for any other purpose. In particular, this report should not be construed as a solicitation of an offer to buy or sell any security. Information contained herein was obtained and derived from independent third-party sources. Alamar Capital Management, LLC believes the sources are reliable; however, it cannot guarantee the accuracy of such information and has not independently verified the accuracy or completeness of such information.
This publication, and the information contained herein, may not be copied, reproduced, republished, or posted in whole or in part, in any form or media without the prior written consent of Alamar Capital.
ACM Commentary 3Q 2021
The third quarter of 2021 started very strong as the economy continued to work its way through the COVID pandemic. Corporate earnings continued their strong trajectory and consumers remained active. Equities across most sectors and capitalizations experienced moderate increases in July and August however, those gains were mostly erased as we moved through September. Positive market sentiment was quickly altered as news of real estate problems in China, a less than certain outlook for the Democratic driven infrastructure bill, rising inflation, and a resurgence in the delta variant all created a level of uncertainty that had not been seen for several quarters. For their part, markets corrected 5% as the uncertainty gained traction, and concerns that the economy was overheating were quickly replaced with deteriorating growth fears.
As shown below, despite the September weakness, markets were generally positive to slightly negative for the quarter with year-to-date returns remaining strong. During the quarter, large capitalization companies outperformed small caps while growth outperformed value. U.S equities remained the strongest on a global basis while developed markets strongly outperformed the emerging markets. Fixed income markets were generally flat for the quarter however with the September inflation fears, bonds sold off through the last two weeks of the quarter.
In our last quarterly writing we touched on the topic of the prospect of long-term inflation as a result of strong demand and Fed money-printing. We also touched on housing, which represents 1/3 of the overall Consumer Price Index (CPI). We identified a large future supply of housing stock in the U.S. as a potential offsetting impact on the risk of future inflationary pressure. This combined with the October revelation of a growing real estate crisis in China has added additional uncertainty, and to an extent further clouded the inflationary view.
Though, It is hard to argue that inflation is not presenting a clear and present challenge to consumers and business owners. This is especially true for low-income earners who have been hardest hit by the pandemic, and that suffer the most as prices for basic goods increase. However, the long-term rate of inflation is where the debate sits. All commodities, especially energy, are showing sharp increases due to global supply chain disruption and COVID related production shutdowns. We believe pricing will remain elevated but will moderate as the supply chain corrects and the restocking of shelves abates. Additionally, with the second largest economy in the world, a slowing China should add a dampening as China is the largest consumer of commodities. The impact of the supply chain on inflation is hard to understate and is revealed by separating inflation in goods vs services inflation in the U.S. economy. As you can see in the chart below, inflationary pressures within the services sector of the economy, though pronounced, have been much more tepid than that on the goods side. The chart depicts a breakdown of the 12-month percentage change of the Consumer Price Index (CPI), by all categories compared to just the Services components and is provided by the Bureau of Labor Statistics.

CPI has dramatically outpaced Services sector inflation in recent months. It has surged in excess of 5% since April of this year, was up 5.4% in September and at the close of October it increased to a concerning 6.2%. It had not previously exceeded 5% since the summer of 2008 and been higher than 6% since 1990. Ominously, both these prior time periods experienced recessions. The picture is a bit more comforting, though, when looking at the Services sector less energy where inflation has remained fairly in check. Curiously, over the past 20 years services inflation has run at a higher clip than CPI. This reflects the pivoting nature of the U.S. economy which has grown more service based in recent years and that segment of the commanding pricing power due to strong demand. However, CPI has drastically outpaced services inflation as we make our way out of the COVID crisis and the cost to import goods to the U.S. has temporarily increased forcing manufacturers to pass on those price increases to consumers. For example, prices have increased for new and used vehicles by 8.7% and 24.4% respectively through September of this year. Meanwhile the rent of a primary residence and owner’s equivalent rent were up 2.4% and 2.9% respectively. It is important to note that these increases are coming off of very low comps given the unprecedented complete closing of the economy in 2020. It is also difficult to foresee continued increases of this magnitude in the longer term.
No doubt the inflation debate has been a hot topic for investors and media pundits alike, but an even more dangerous concept emerged in September, instilling fright in investors. In part due to aforementioned economic challenges in China, and given the recent supply shocks, a growing concern developed that the global economy was not overheating, but rather slowing. This placed a considerable amount of pressure on already robust earnings expectations heading into the third quarter earnings season. The concern was that already existent inflation combined with a contracting economy would result in an even more dreaded stagflationary environment. Defined as persistent high inflation combined with high unemployment and stagnant demand, stagflation is feared because there really is no known antidote. This is because the normal responses to the two major components of stagflation—recession and inflation—are diametrically opposed. The cure for high inflation, or tighter monetary policy only acts to further punish the economy by further slowing growth and vice versa. Figure 2 depicts the google search activity for the topic “stagnation” the extent of stagnation concern entering into this fall.

As you can see, the last time the interest level was this high was in the months leading up to the great recession. Given this level of heightened interest a pullback in the markets in September is surely understandable.
After all, a fear of rising interest rates is to be expected given the continued massive fiscal and monetary accommodation since the arrival of the Coronavirus. Afterall, the supply of U.S. dollars increased by an unprecedented 25% in 2020 alone! However, an increase in the money supply is not in and of itself inflationary. This is especially the case if the printed dollars end up not as loans, but as deposits on banks’ balance sheets or savings in investment securities portfolios. We have discussed this in previous writings. For the remainder of this writing, we thought we would focus on the other key ingredient for stagflation – a slowing economy.
From our perspective it is hard to find significant signs of a slowing economy. In fact, there are several key measures that brighten the growth side of the stagflation fear:
October aggregate hours worked has increased by approximately 5% indicating a stronger employment outlook.
Sentiment across manufacturing and service industries, as measured by the ISM Composite PMI, is reporting above 62 which has historically been consistent with GDP growth of 5-6% annually.
Consumer spending as measured by credit card receipts are increasing, signaling consumer confidence.
Travel, which is also a strong indicator of consumer confidence, is growing as COVID fears are abating with increased vaccinations and lower infection rates.
Lastly, and perhaps most important as it relates to the Alamar equity strategy – corporate profits are growing at a pace that is even higher than last year.
At Alamar, we are focused on actively managing a portfolio of companies and less focused on predicting the economy, we have witnessed a continued undeniable strength in corporate performance as of late.
For its part and as reported by FactSet, The S&P 500 is on track to report earnings growth in excess of 30% for the third straight quarter. Additionally, despite all of the inflation talk about compressing margins, the S&P 500 is so far reporting its third highest profit margin since 2008. So, despite the rising fears of stagflation and economic slowdown, we feel very good about the prospects for corporate earnings and continued growth (Figure 3).

Turning the discussion to Alamar and our approach to investing, it is important to again highlight that we seek to identify a limited number of investment opportunities to structure our client portfolios. At the center of our philosophy is the desire to invest in and own companies that have a proven ability to generate good earnings growth. We do not seek to own the entire market, such as an index fund or ETF, but instead want to own superior companies on a variety of financial and qualitative metrics. The economic backdrop of inflation, changing monetary policy or even the fear of stagflation only creates volatility and valuation opportunities for us to take advantage of. We are excited by the companies we currently own as they continue to meet and in many cases exceed our expectations for growth and profitability. Further, we remain confident more great ideas will surface as the economic landscape ebbs and flows around this earnings season, as well as those to come.
We will continue to monitor economic conditions and make adjustments to our portfolio based on individual company fundamentals. We sincerely appreciate the opportunity to invest alongside, and on behalf, of our current clients. We would welcome the opportunity to further discuss our investment philosophy, and process with those who have not found your way to invest with us yet.
Please continue to stay safe and healthy –
Best regards,
John Murphy, CFA Chris Crawshaw, CFA
DISCLOSURES
The views expressed in this note are initially published and are subject to change without notice. Alamar has no obligation or duty to update the information contained in this note. Past performance is not an indication of future results. Risk is inherent in investments and involves the possibility of loss. Net of fee performance is calculated using the highest fee. The Russell 3000 Index measures the performance of the largest 3000 U.S. companies representing approximately 98% of the investable U.S. equity market. The S&P 500 Index, which is a market-capitalization weighted index containing the 500 most widely held companies chosen with respect to market size, liquidity, and industry.
This publication is made available for informational purposes only and should not be used for any other purpose. This report should not be construed as a solicitation of an offer to buy or sell any security. Information contained herein was obtained and derived from independent third-party sources. Alamar Capital Management, LLC believes the sources are reliable; however, it cannot guarantee the accuracy of such information and has not independently verified the accuracy or completeness of such information.
This publication, and the information contained herein, may not be copied, reproduced, republished, or posted in whole or in part, in any form or media without the prior written consent of Alamar Capital.
ACM Commentary 2Q 2021
Halfway through 2021, our forecasts for this year are on track. Thanks to the rapid rollout of vaccines, the Covid-19 viral outbreak seems to be getting under control. While the emergence of variants such as Delta and Lambda needs to be watched carefully, studies so far indicate that the vaccines protect against severe outcomes. As a result, the US economy is booming! Almost all of our investments have beaten their outlook and raised guidance for this year. We expect this trend to continue for the rest of the year.
In our view, the biggest overhang on the market now is the prospect for long-term inflation. Many economists and market experts are forecasting a long period of rising inflation because of strong demand and Fed money printing. We are doubtful their forecasts will come to fruition. There are many long-term trends keeping inflationary forces at bay such as demographics (aging and slow growing population) and declining money velocity; we will delve into one important one – housing costs – in this note.
BACK TO THE 70’s SHOW?
Inflation, as measured by the Consumer Price Index (CPI), is rising rapidly recently. Figure 1 shows the CPI over the last six decades. After moderating for the last 30 years, headline inflation has spiked recently to over 5%. There are fears in the market that we may be heading to a period of sustained inflation reminiscent of the 1970s. Market experts point to rising prices of commodities such as oil, lumber, corn, wheat, and soybeans as indicators of inflationary pressures to come. Another factor, that directly hits consumers and is a large portion of the CPI index, is housing. Housing prices are rising across the board, particularly at the low-end. Figure 2 depicts the Case-Shiller index for national house prices. After peaking in mid-2006 house prices collapsed over 25%, bottoming out in early 2012. Now prices are booming again, up 85% from the bottom. The chart clearly shows that prices are once again moving away from long-term trends. The trigger for the breakout was the Covid-19 pandemic since prices didn’t begin their recent spike until 2H 2020. Covid-19 spurred a furious demand for homes because people wanted to get away from dense environments. Work-from anywhere allowed homeowners to move away from expensive urban, primarily coastal, cities to states like Texas, Nevada and Arizona where they could purchase newer, larger homes with a yard for a lower price. In many cases the monthly mortgage payment was lower than their prior rental payment due to low mortgage rates and cheaper land prices.
This dramatic increase in demand for housing has led to furious bidding wars for homes. Inventory for both new and existing homes have fallen to all-time lows. Figure 3 depicts months of available housing inventory at current selling rates. Housing inventory is now roughly 2 months for existing homes and below 4 months for new homes. This is a faster pace than back during the 2005 housing bubble when inventory for existing homes was 4 months.


Housing is a very important contributor to overall inflation since it represents approximately 33% of the overall CPI index. Hence, the future course of house prices, and more importantly, rents, will be crucial to determine the pace of inflation. So, why are we so
sanguine about future inflationary pressures given the dynamics affecting house prices? The answer lies in the future supply of housing. There is a tsunami of new housing units coming on the market in the next few years.
For many years we have surveyed new housing units built by a large group of home builders. Figure 4 plots the total single family units ordered and delivered by this group. As you can see from the graph, orders for new housing peaked in Q4 2005 at 83,000 units in our sample; deliveries followed 6 months later. Following the housing bust, units ordered and delivered fell 75% to roughly 20,000 units, bottoming out in 2011. Since then housing has been on a steady uptrend and has now accelerated with the onset of the pandemic. Orders this year will comfortably break the prior peak. It is a great time to purchase a new house, particularly if you are willing to relocate from the expensive coastal cities to the middle of the country. Unlike existing homes, new home prices relative to incomes have never been lower. Figure 5 plots new home prices in our sample and Figure 6 plots new home prices relative to per capita disposable household income.


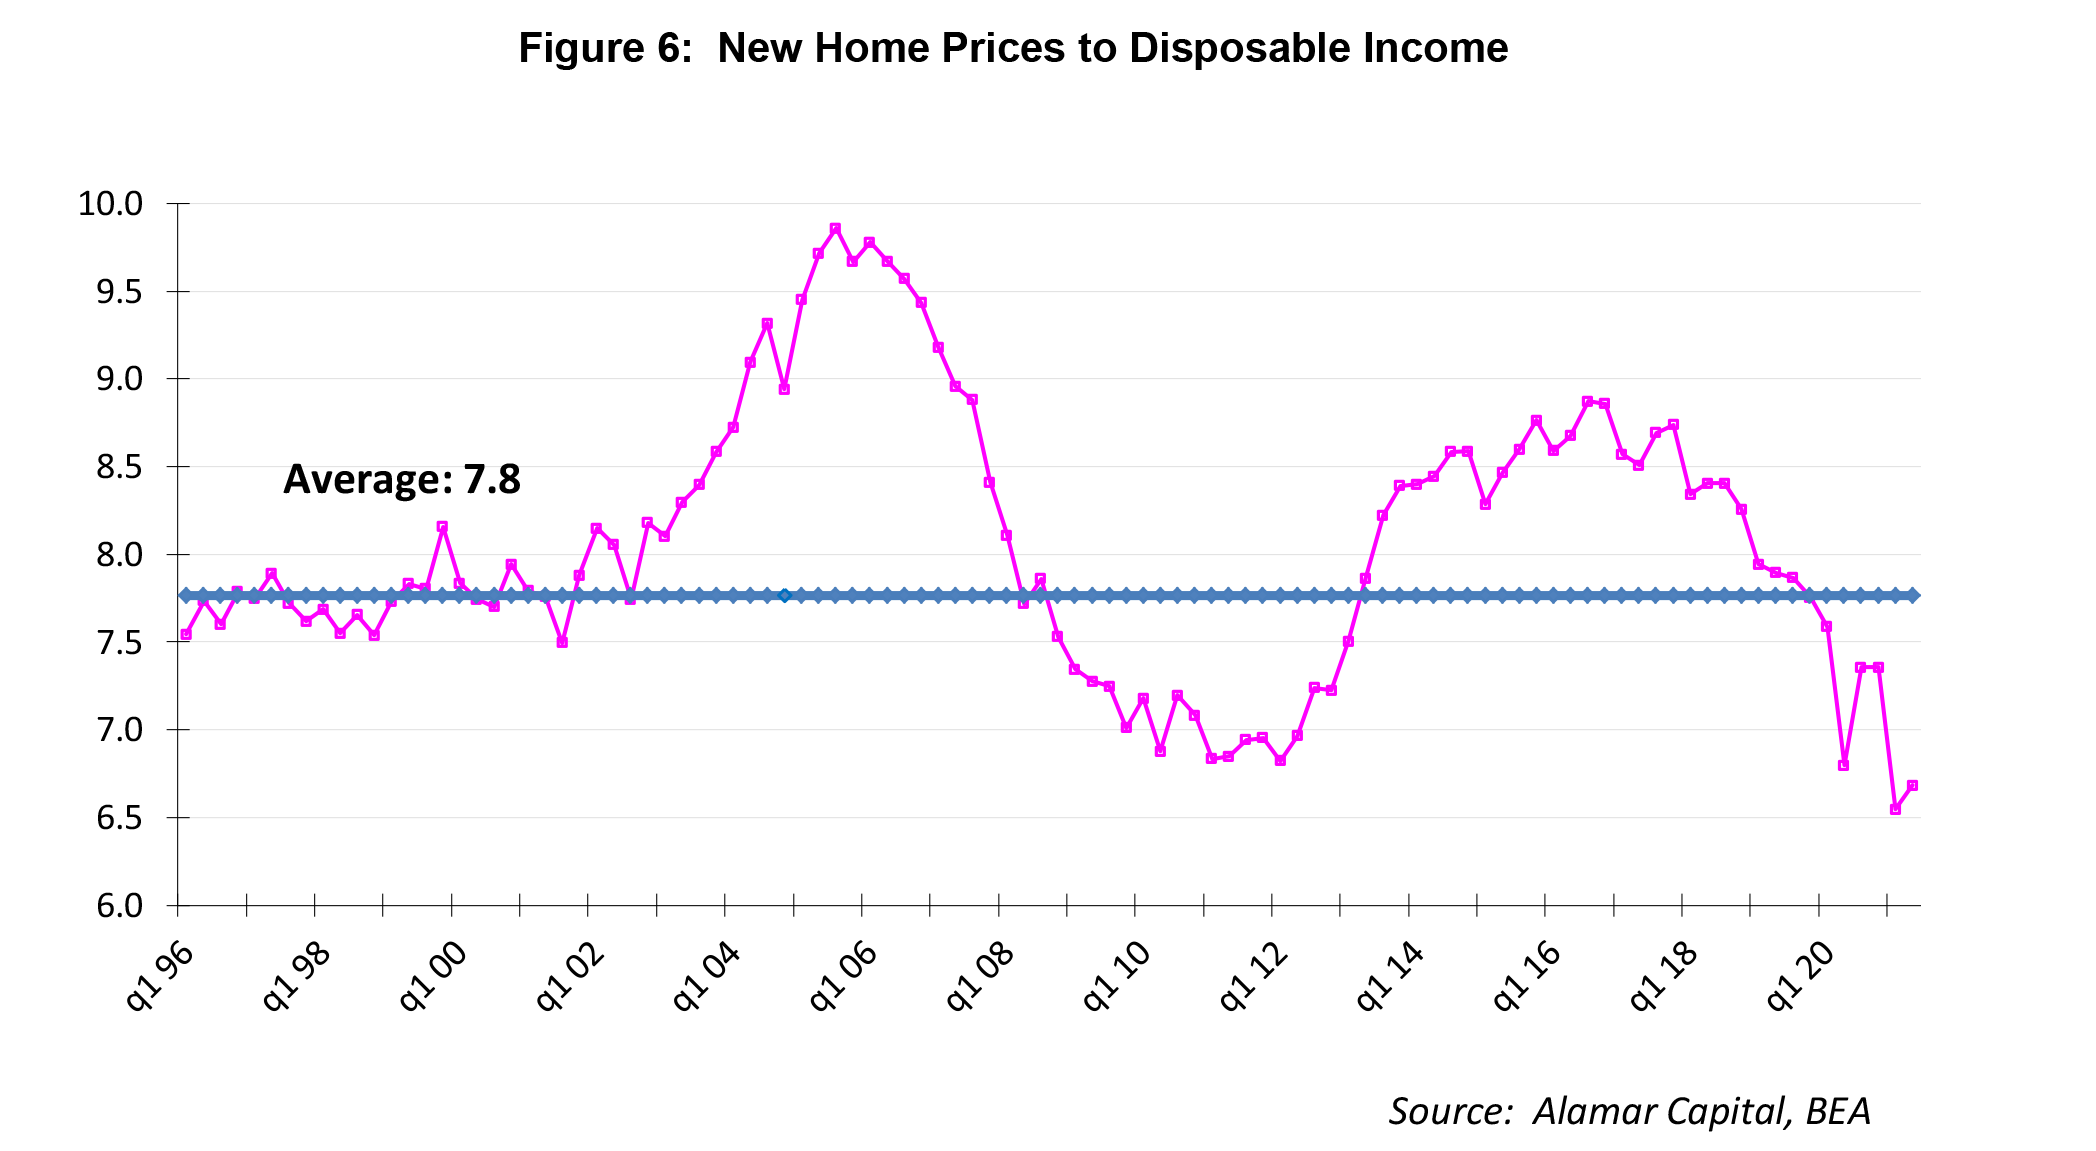
As you can see, new home prices are averaging roughly $390,000 nationwide in our sample. Note that our sample includes all the major homebuilders who build homes across all regions of the country. Unlike existing homes, average new home prices have barely budged since 2015. To be sure, our sample captures geographic mix transfers as demand shifts across the country. When a homeowner sells their house in California and purchases a new house in Texas, demand shifts from an expensive to a more cost-effective region. Our sample captures this shift, while a price index such as the S&P Case-Shiller does not. If their income in Texas is roughly similar to what they were earning in California, their home price-to-income ratio will decline substantially. They will save a lot of money while at the same time upgrading to a brand new house with all the latest amenities.
We expect this dynamic to continue given the advent of work-from-anywhere and companies moving from expensive locales to more cost-effective interiors. As a result we forecast the delivery of new homes to continue to build from here. The supply of new, lower priced homes will inevitably dampen price increases on existing homes and rents. The best cure to a high price is a high price.
CONCLUDING THOUGHTS
We have a constructive outlook on the market for the rest of the year and beyond. We are finding good, reasonably priced investments in the current environment. Moreover, most of our current investments have easily beaten our expectations and raised guidance, and we expect that to continue this quarter. Unlike many experts, we are not overly concerned with long-term inflationary pressures. The biggest driver of inflation, housing costs, will likely ameliorate over time as a surge of new housing supply hits the market. There has never been a better time to purchase a new home, especially if you are a renter in a high priced coastal city, provided you are willing to relocate.
Thank you for your continued trust and confidence in Alamar Capital Management.
Sincerely,
George Tharakan, CFA
george@alamarcapital.com
Disclosures
The views expressed in this note are as of the date initially published and are subject to change without notice. Alamar has no obligation or duty to update the information contained in this note. Past performance is not an indication of future results. Risk is inherent in investments and involves the possibility of loss.
This publication is made available for informational purposes only and should not be used for any other purpose. In particular, this report should not be construed as a solicitation of an offer to buy or sell any security. Information contained herein was obtained and derived from independent third-party sources. Alamar Capital Management, LLC believes the sources are reliable; however, it cannot guarantee the accuracy of such information and has not independently verified the accuracy or completeness of such information.
This publication, and the information contained herein, may not be copied, reproduced, republished, or posted in whole or in part, in any form or media without the prior written consent of Alamar Capital.
ACM Commentary 1Q 2021
With the arrival of March, we stumbled across the one-year anniversary of the COVID-19 related global lockdowns that resulted in the fastest and deepest contraction in the economy since WW II. There is much to celebrate this spring, most notably continued and accelerating progress on the vaccination front.
By the end of March more than 150 million Covid vaccines had been administered in the United States. As of this writing, more than 3 million shots are being injected into the arms of U.S. citizens per day. A remarkable scientific achievement, especially given where we were just 12 months ago. It is likely that Covid-19 will be with us for many years to come and a continual evolution of the virus with additional strains is to be expected. However, the march towards herd immunity continues, and fortunately, the current round of vaccinations has proven effective against known mutations so far. In one of the largest signs of progress, just this week the CDC lifted mask requirements in outdoor spaces for US citizens who are fully vaccinated.
This news, combined with the continuation of massively accommodative fiscal and monetary policies, added to an already pre-existing risk on sentiment for investors in the quarter. This was particularly evident in the month of March as shown below. For our part at Alamar, we anticipate the economy to continue to accelerate in the months ahead given the continued steady reopening of the economy’s service sector and strong monetary and fiscal support. The returns in the market are, of course, more difficult to predict in the short term. However, it is fair to say that few, if any, investors anticipated the returns that have been generated and the progress that has been made in the past year. Additionally, a sudden and dramatic spike in interest rates during the quarter, attributable to inflationary risk, has begun to fray investor nerves, particularly in the fixed income market. The chart in Figure 1 below depicts the performance of various asset classes over several different time periods.
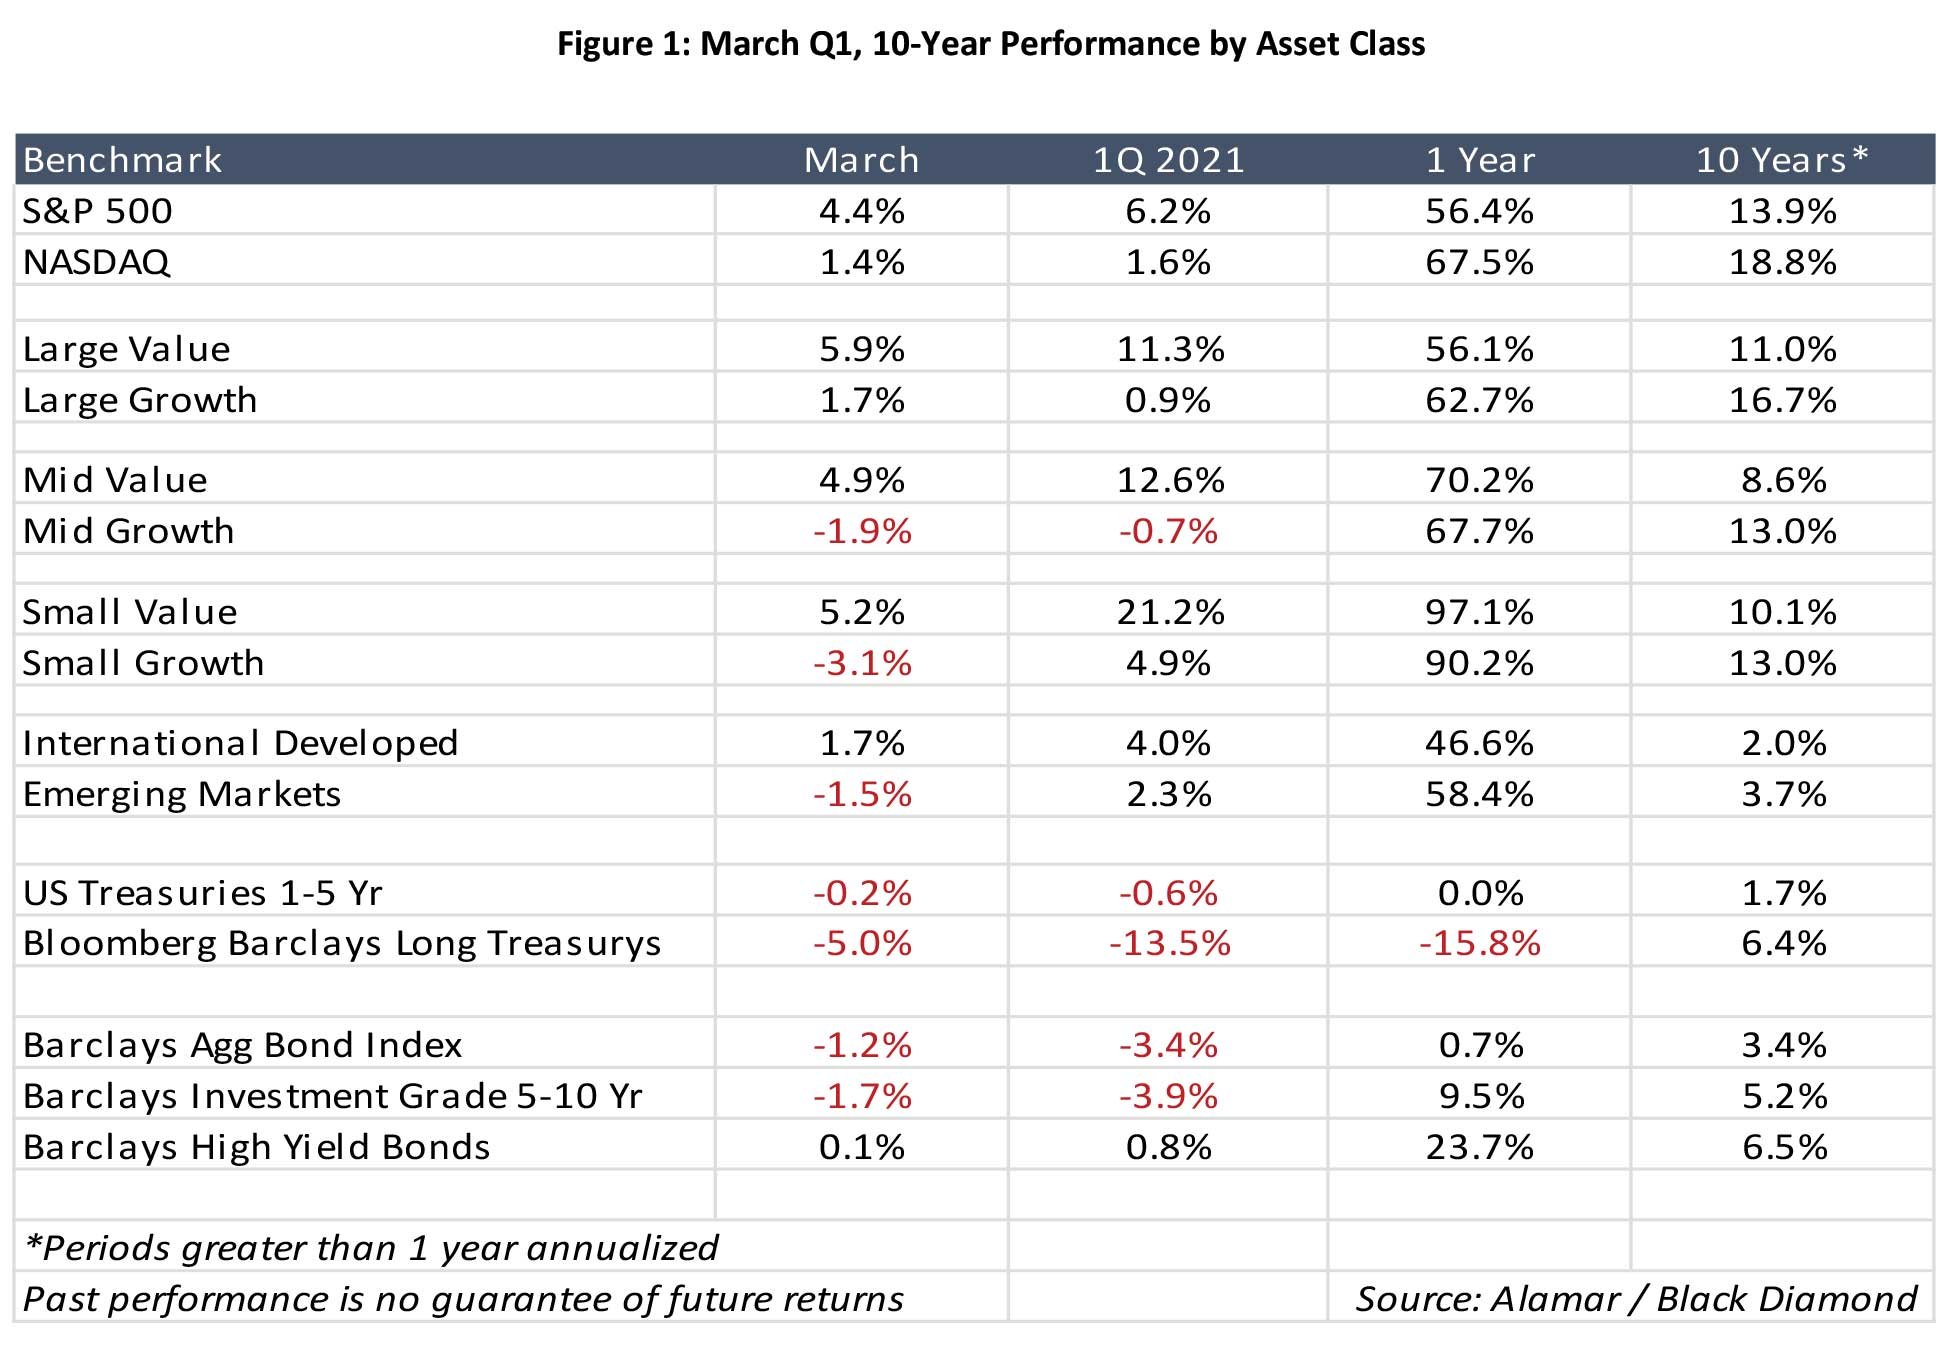
As you can see from the chart, equity investors across the board were rewarded in the quarter, with value outperforming growth. As we discussed towards the end of last year, we view this as a positive development relative to the health of the overall stock market. Older economy value names have reacted favorably to progress on the vaccination front and the beginning of the end of the Covid crisis. Additionally, a spike in interest rates had a deteriorating effect on the valuations of higher-growing companies in the economy. The present value of their future cash flows is discounted back at a higher-level, necessitating lower current valuation.
Likewise, higher rates had a similar negative impact on the fixed income market. This is because higher current interest rates require that bond prices be reduced to allow the purchaser of a bond to secure a yield that is in line with the current environment, not the date in which the bond was issued. In what has been a very low interest rate environment, credit investors have been left with two choices to increase the yield in their portfolios: either extend the maturity of the bonds they purchase- in simpler terms lend money for a longer period- or increase the credit risk of their portfolio by lending to less creditworthy borrowers. A continued improvement in the economy saw a varied outcome based on these two choices. High yield bonds sought out small gains in the quarter as credit spreads shortened and defaults reached multi-year lows. Meanwhile, the bell weather Barclays Aggregate bond index was down -3.4% in the quarter, while intermediate corporate bonds fell by a similar -3.9%. With long-term treasuries down -13.5% in the quarter. Investors who lent out for the long haul were hit the hardest. This recent move reverses a trend in the earlier innings of the Covid-19 Crisis, when the dramatic and somewhat shocking fall in rates rewarded long term bond holders. The sharp move in rates in the quarter can be seen in the chart below, which depicts the yield on 10 Year US treasury bonds dating back to before the financial crisis.

The current prevailing view is that Real GDP growth in the U.S. economy will exceed 6% this year and the recent move in interest rates is attributed to the view that the combination of stimulus and rapid growth will lead to rising prices. After all, the U.S. Economy experienced stubbornly high inflation in the 1970’s and early 1980’s, last reaching double digits in 1981 (Figure 3). It is the view of most economists that this was caused by overly expansionary monetary and fiscal policies, along with significant increases in energy prices. That resulted in Fed Chairman Paul Volker courageously raising short term interest rates in the early 1980s to bring down inflation, but at the cost of a recession. Since 1991 inflation has remained below 5%. Further, for the great majority of the period since the 2007 – 2009 Great Recession, inflation has been below the Fed’s target of 2%, which it established as its goal in 2012. This, despite fiscal and monetary policy, has been dramatically more stimulative than the high inflation period of the 1970s and early 80’s.

The question left for investors today is whether things are different this go-around, or if we are doomed to repeat the same fate. For our part at Alamar, we are not convinced inflation is at hand, at least not yet, and the Federal Reserve appears to agree with us. The Great Recession and COVID-19 induced recession represent the two deepest recessions since the Great Depression. In both downturns, rapidly rising unemployment made inflation unlikely. Despite the massive stimulus, inflation has remained contained, as unemployment rates had been falling dramatically in the years preceding the COVID-19 pandemic.
This has likely emboldened the Fed. Overlooking growing concerns, they have pledged to keep short-term interest rates at zero until the economy reaches full employment and inflation is modestly above 2%, which Fed leadership does not expect until 2023 at the earliest. Figure 4 below is provided by the St. Louis Fed and it indicates both their actual and projected inflation rates in the near term.
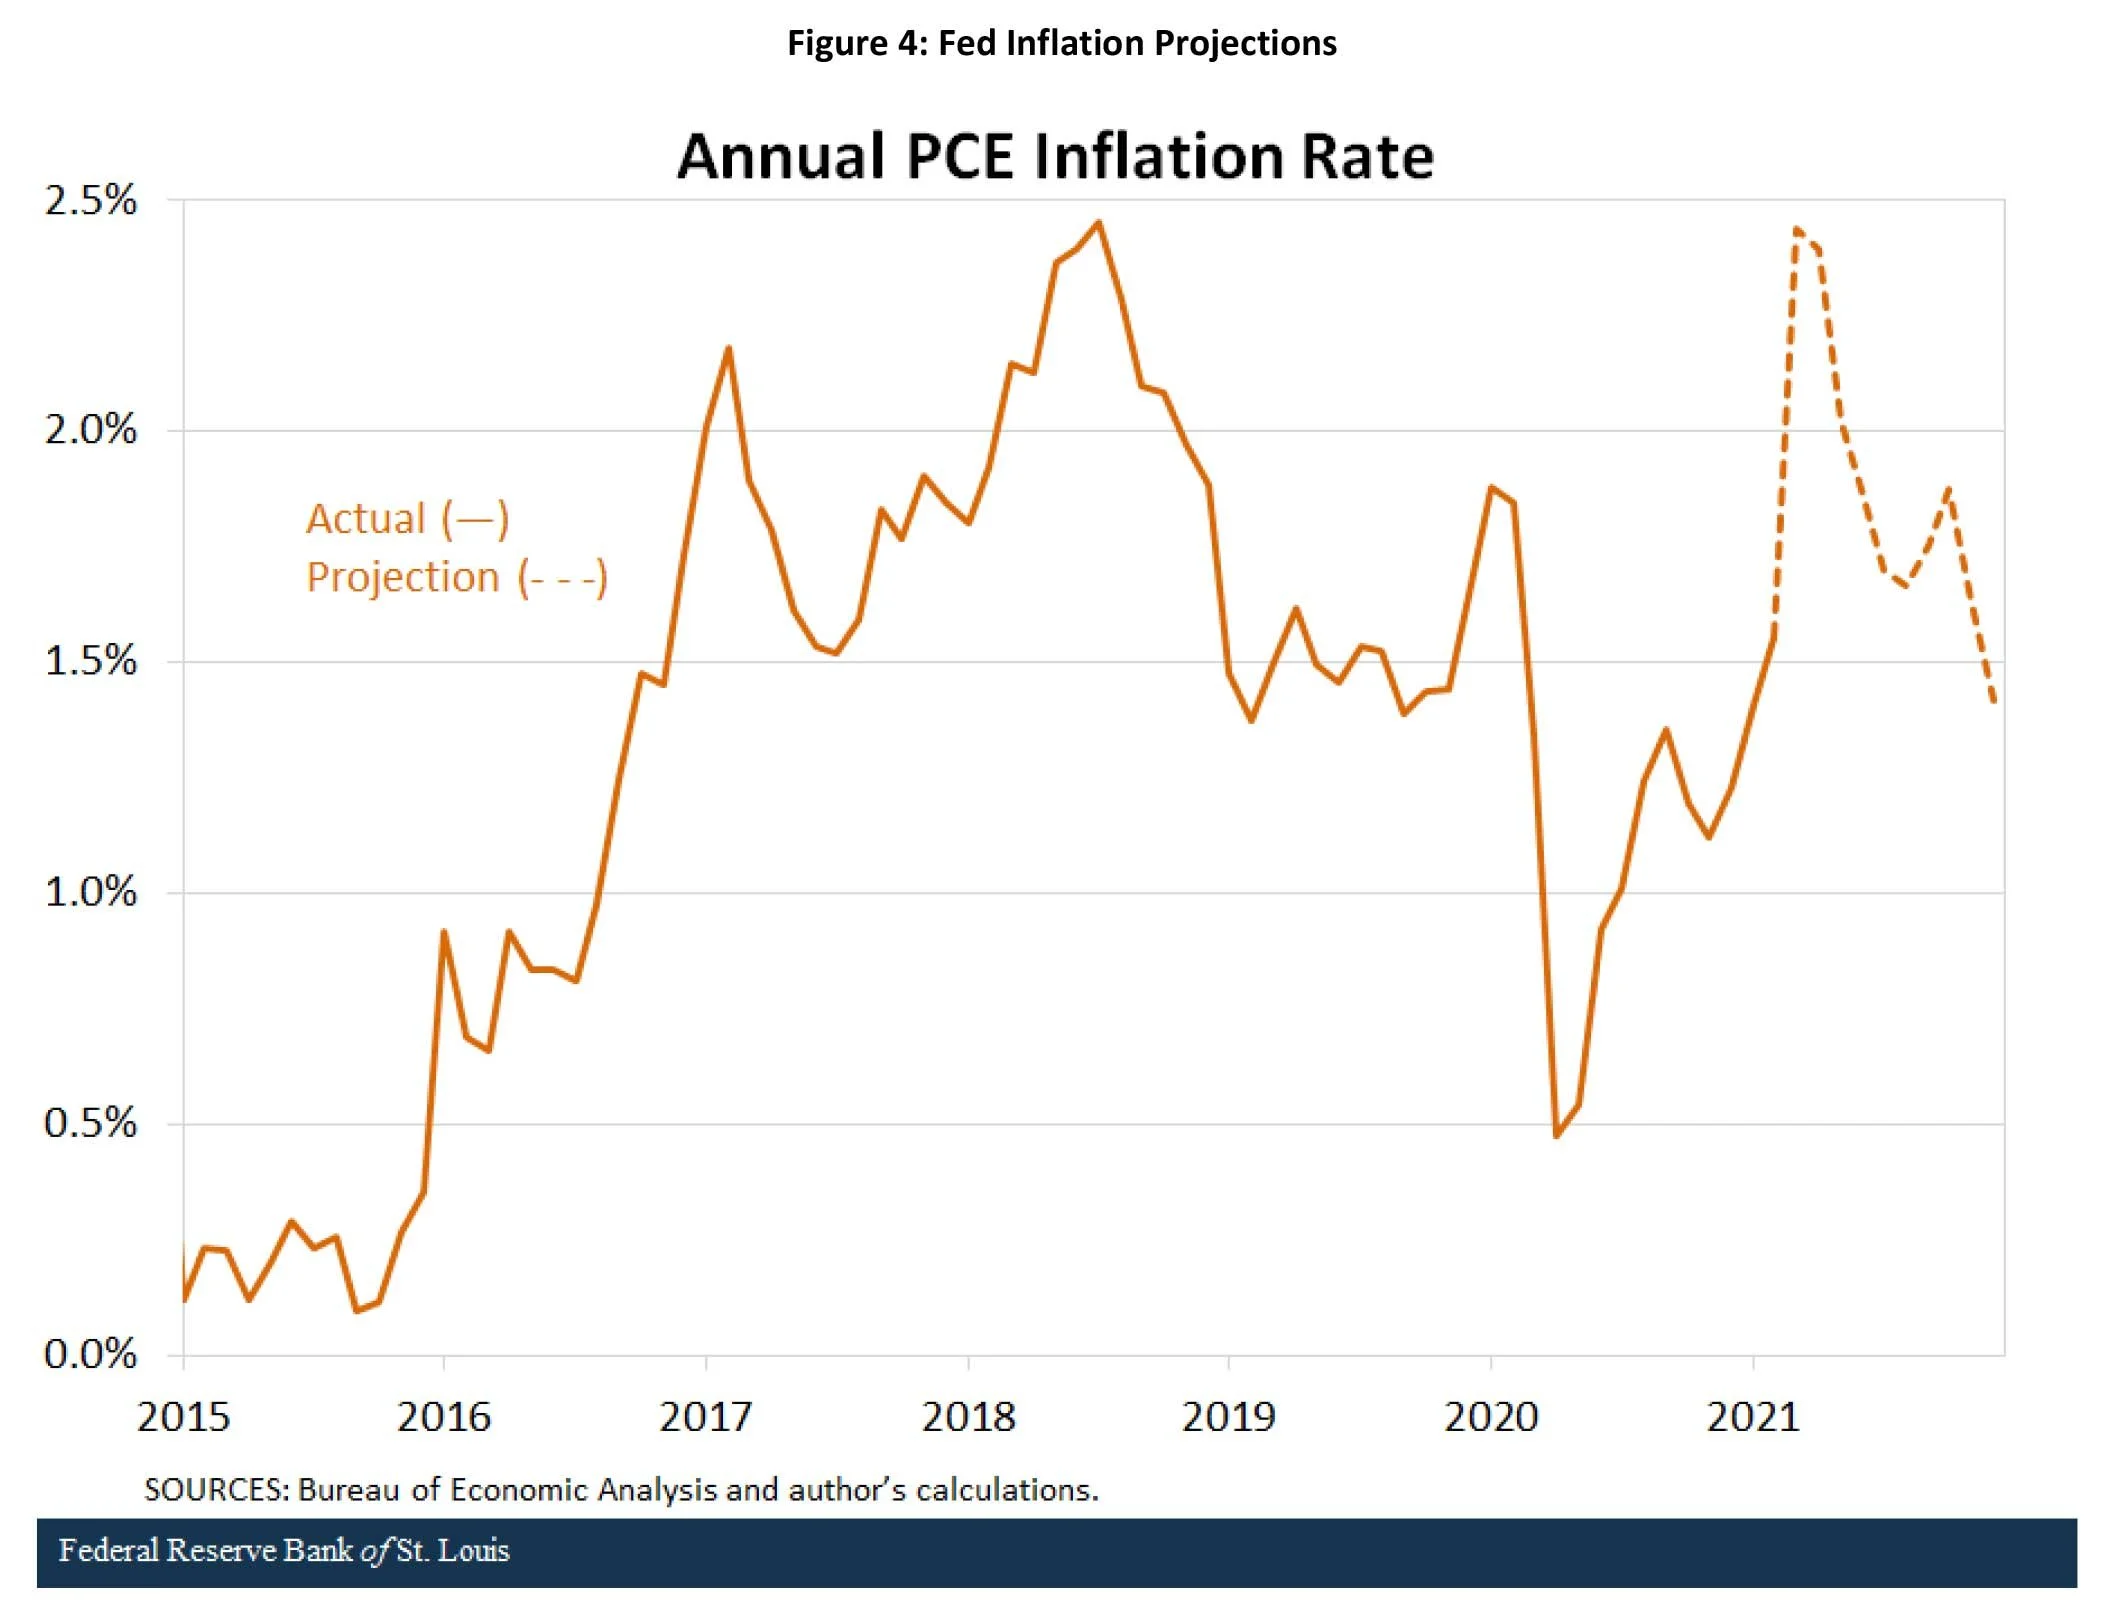
Their projections for inflation include a brief spike in the spring and then a convergence back towards the pre-pandemic average nearing the end of 2021. In other words, we should not expect the Fed to react to a “temporary” rise in inflation. This view, combined with continued stimulus is a bullish indicator for the equity markets, and perhaps even fixed income if the Fed’s thesis plays out as predicted.
On the fiscal side the budget deficit is projected to be around 15% of GDP in 2021. On March 11th, the $1.9 trillion American Rescue Plan was signed into law. This stimulus clearly acted as a tailwind for the economy, enabling many to purchase necessary goods and services.
However, another large beneficiary appears to be the stock market itself. According to data aggregation company Envestnet Yodlee, many consumers used at least some of that money to speculate in the stock market; their research indicates that securities trading was among the most common uses for the government stimulus checks across nearly every income bracket. Interestingly, the numbers were particularly high for those in the $35,000 to $75,000 income bracket, where trading came in third behind only increasing savings and cash withdrawals.
Not to be outdone by the American Rescue Plan, further fiscal stimulus has been proposed through a $2.25 trillion American Jobs Plan. Anticipated to be spent over 8 years, the plan has garnered much attention for its very broad interpretation of “infrastructure”. The plan is summarized below in Figure 5.

Though it does commit up to $621 billion to politically consensus building infrastructure-oriented segments like highways bridges and roads $115 billion, Public transit $85 billion and passenger and freight rail $80 Billion. Much to the consternation of many Republicans, it also incorporates a $650 billion Infrastructure at Home component allotted to investments less related to infrastructure, such as $213 billion reserved for affordable and sustainable housing and $137 Billion for public schools. Further, the plan allocates $400 billion to a Caretaking component for home and community-based care for the elderly and disabled. A closer look at the traditional Transportation and Infrastructure segment also shows $174 billion reserved for electric vehicles. In recent days, the Republican leadership has offered a scaled-back $800 billion Infrastructure plan of their own. It is clear further negotiation will lead to a deal.
Shifting our focus to the stock market, the picture is also quite rosy at present. So far in the first quarter, earnings growth has been very strong, with a significant number of companies in the S&P 500 beating already optimistic Wall Street expectations. Below you will find historical and projected earnings and profitability on the S&P 500 and Nasdaq dating back to the Great Recession. As you can see from the chart, according to FactSet projections the S&P 500 is currently projected to grow earnings by 33% in 2021, and 12% in 2022.
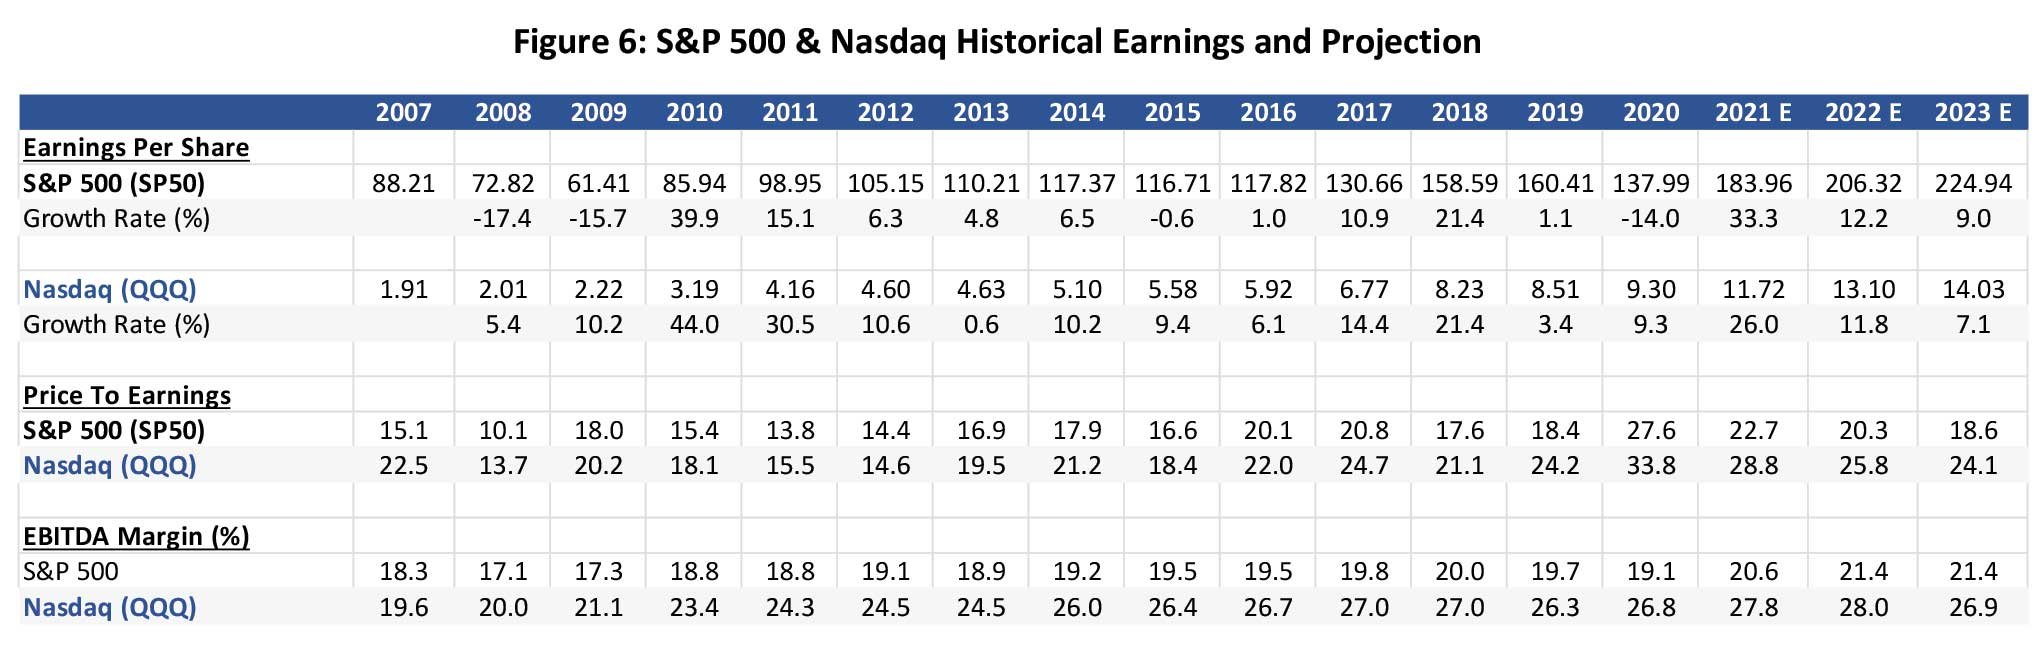
The newer economy Nasdaq is projected to grow at slightly lower levels, but with considerably higher profitability (Ebitda margins) over the same period. Also notable from the data has been the propensity for the Nasdaq names to achieve positive EPS growth during both the 2008-09 Great Recession and the last year (9.3% vs -14.0%), a feat that the S&P was not able to accomplish.
The combination of Covid pandemic relief, massive fiscal and monetary stimulus, accommodative Fed posturing, and solid earnings and profitability growth has made for strong market returns and a nice back drop for the economy and market looking forward. At Alamar, we continue to find attractive ideas for investment in our portfolio.
Please continue to stay safe and healthy –
Best regards,
John Murphy, CFA
DISCLOSURES
The views expressed in this note are initially published and are subject to change without notice. Alamar has no obligation or duty to update the information contained in this note. Past performance is not an indication of future results. Risk is inherent in investments and involves the possibility of loss. Net of fee performance is calculated using the highest fee. The Russell 3000 Index measures the performance of the largest 3000 U.S. companies representing approximately 98% of the investable U.S. equity market. The S&P 500 Index, which is a market-capitalization weighted index containing the 500 most widely held companies chosen with respect to market size, liquidity, and industry.
This publication is made available for informational purposes only and should not be used for any other purpose. This report should not be construed as a solicitation of an offer to buy or sell any security. Information contained herein was obtained and derived from independent third-party sources. Alamar Capital Management, LLC believes the sources are reliable; however, it cannot guarantee the accuracy of such information and has not independently verified the accuracy or completeness of such information.
This publication, and the information contained herein, may not be copied, reproduced, republished, or posted in whole or in part, in any form or media without the prior written consent of Alamar Capital.
ACM Commentary 4Q 2020
Last year was one for the history books. In our view, historians and scientists will look back and be aghast at the sheer lack of preparation and ineptitude at all levels of government to deal with the COVID-19 outbreak. We hope you and your family are staying safe and healthy during this pandemic.
Alamar’s equity portfolio was up 40.9% last year while the S&P500 was up 18.4%. Since starting in 2010 our equity portfolio is up 15.8% annualized while the S&P500 grew 14.0%. A client who invested $1 Million with us at our inception would now own a portfolio of stocks worth over $5 Million. A large portion of the performance of the S&P500, once again, came from just a few stocks (FAMAA – Facebook, Apple, Microsoft, Amazon and Alphabet). In fact, more than half the performance of the S&P500 last year came from just these 5 stocks! Most large stock indices such as the S&P500, Russell 1000 and the NASDAQ 100 are now overly reliant on these 5 stocks, plus Tesla and Netflix, to power their performance, a very precarious position, in our view. We have never owned any of these stocks. We are pleased to report Morningstar recently ranked our performance against our peers and the Alamar Equity portfolio was awarded 5 Stars, their highest ranking, in all time frames. In addition we received the top risk-adjusted ratings (performance when adjusted for the risk incurred) when compared to our competitors. Avoiding the crowded and popular investments has served us well.
The economy is set to boom this year. Both fiscal and monetary policies are extremely accommodative. The biggest headwind facing the economy is the spread of the COVID-19 pandemic; however, we believe we are close to turning the corner as explained in this note. We will also explore the cost of being overly cautious or indecisive when investing in public equities.
THE HIGH COST OF DITHERING
When new clients join Alamar, they are usually moving from another investment manager. The clients are typically dissatisfied with the performance of their investments, the poor client service, or both. When evaluating their existing investments we inevitably see an equity portfolio with anywhere from 10 to 20 ETFs and mutual funds, sometimes sprinkled with a few popular names such as FAMAA, Netflix or Tesla. A portfolio composed of 10 or more ETFs/Mutual funds is destined for mediocrity. It exposes a lack of investing acumen or experience. Each ETF or mutual fund may own anywhere from 100 to over 1,000 securities. As a result the client effectively has invested in a portfolio of over 2,000 securities without realizing what has occurred. A portfolio with such a large number of securities indicates a lack of conviction and analysis. The managers are unwilling or unable to make a decision on where to focus their attention, to look for mispriced securities, to have a viewpoint on the economic fundamentals and to perform the hard work required to unearth great investments. Such a portfolio is doomed to mediocre performance. We looked to see if this was a widespread phenomenon and found a working paper written by Professors Sandeep Dahiya and David Yermack1. The paper looks at the investment returns of almost 30,000 endowment funds from 2009 to 2017. For 2018 and 2019 we used the returns from the NACUBO survey of 774 colleges and affiliated foundations. While these are not completely comparable, a large portion of the total endowment assets are managed by colleges and universities.
Figure 1 depicts the performance of the average endowment compared to an Alamar equity account and a simple 60/40 index (60% in S&P500 and 40% in a bond index such as the Barclays US Aggregate). We have left out the 2020 performance for endowments since they are unavailable as of this writing but we expect roughly 7% returns from early reports disclosed so far. The series are not entirely comparable because college endowments get access to many illiquid investments through venture capital, private-equity, real-estate and hedge funds while Alamar’s portfolio is composed entirely of liquid, publicly traded stocks in the US. However, we invest in a fairly concentrated portfolio of 35 to 50 securities while an average endowment probably has well over 100 once the ETFs and funds are fully decomposed. Therefore the average endowment may be less aggressively positioned or embracing less risk than Alamar.

As seen above, the average endowment, by spreading its bets across many asset classes and securities, has woefully underperformed Alamar and even the 60/40 allocation. The clients who join us from other managers have experienced similar performance.
OUTLOOK FOR 2021
The economy is set to grow rapidly this year. Tailwinds include:
A very accommodative Federal Reserve (real interest rates are negative across most of the yield curve)
Large fiscal deficits
Control of the Presidency, House and Senate with one party making it easier to pass large spending bills.
A weak US Dollar boosts exports and also provides benefits when companies translate overseas sales.
In addition, we believe the news from the COVID-19 pandemic should soon start to get better. A recent paper in the Journal of American Medical Association (JAMA) 2 estimated that roughly 14.3% of the US population had been infected with the SARS-COV-2 virus as of November 15, 2020. Assuming a similar growth trajectory in the infection rate we estimate roughly 30% of the population will have been infected by the end of this month. In addition, with the advent of mass vaccination with vaccines from Pfizer/BioNTech and Moderna, we forecast another 10% of the population will be vaccinated by the end of January. As a result, roughly 40% of the population will have either been exposed to the virus or vaccinated very shortly, getting close to the herd immunity threshold of 60% (assuming a 2.5 reproduction number). New infections should start to materially decrease as we get closer to the immunity threshold. Needless to say, our forecasts are based on assumptions gathered from our readings of numerous publications of the CDC, JAMA and others. We are closely monitoring the ongoing spread to determine if it follows our projections.
A growing economy and a slowing infection will fuel corporate profits. Current estimates call for a rapid increase in profits this year. Figure 2 plots operating profits for the S&P500 since 1960. After dropping 23% in 2020, profits are expected to get back on trend this year, growing 36% to roughly $165 per share. Given the aforementioned tailwinds there is no reason not to expect continued growth in profits next year and beyond.

With such a favorable backdrop, we expect many investment opportunities throughout this year. After a long drought, a plethora of companies have begun to tap the public markets. The recent change by the SEC to allow direct listing by private companies to raise new capital is a very exciting and material development. We expect many companies to tap this route as it avoids the costly and time consuming roadshow to go public. It is also a far more equitable way to allocate scarce shares of newly public entities.
Similarly, we expect a spate of mergers & acquisitions this year as managements gain more confidence in the economic prospects. Interest rates are low, capital is plentiful and banks have plenty of capacity to lend. We have already had one of our largest investments, RealPage, receive a proposal to be acquired by a private-equity firm for over $10 Billion. At the buyout price we will have made over 3 times our investment since we purchased the stock 4 years ago.
CONCLUDING THOUGHTS
Clients who have been with us over the last 11 years have enjoyed a great return. While we cannot expect to repeat the spectacular performance achieved last year, we do believe a long-term investor in our equity strategy will continue to reap rewards as we uncover new opportunities. As we have mentioned before, the pace of change is accelerating and entire industries are being disrupted. New innovative companies led by great management teams are reimagining the playbook. Investors, meanwhile, are overly enamored with a few popular stocks (FAMAA plus Tesla and Netflix), leaving plenty of opportunities for us to prospect. Focusing on a few good ideas provides a much better outcome in the long run than spreading your bets far and wide. As long-term investors, we embrace the magic of compounding returns in a very tax-efficient manner.
We are optimistic our great scientists will get the upper hand on this novel virus. After a troubling initial rollout, the progress on testing and vaccination should accelerate as bottlenecks are removed, getting us closer to herd immunity. The fiscal and monetary stimuli coupled with a waning pandemic should unleash growth across the economy. We are well positioned to participate as opportunities arise.
Thank you for your continued trust and confidence in Alamar Capital Management.
Sincerely,
George Tharakan, CFA
george@alamarcapital.com
1 Investment Returns and Distribution Policies of Non-Profit Endowment Funds, Sandeep Dahiya and David Yermack, SSRN March 2020
2 Estimation of US SARS-CoV-2 Infections, Symptomatic Infections, Hospitalizations, and Deaths Using Seroprevalence Surveys, Angulo et. al. JAMA Jan 5, 2021
Disclosures
The views expressed in this note are as of the date initially published and are subject to change without notice. Alamar has no obligation or duty to update the information contained in this note. Past performance is not an indication of future results. Risk is inherent in investments and involves the possibility of loss.
This publication is made available for informational purposes only and should not be used for any other purpose. In particular, this report should not be construed as a solicitation of an offer to buy or sell any security. Information contained herein was obtained and derived from independent third-party sources. Alamar Capital Management, LLC believes the sources are reliable; however, it cannot guarantee the accuracy of such information and has not independently verified the accuracy or completeness of such information.
This publication, and the information contained herein, may not be copied, reproduced, republished, or posted in whole or in part, in any form or media without the prior written consent of Alamar Capital.
ACM Commentary 3Q 2020
Though it is already well in the rearview mirror, the third quarter saw a continuation of the market’s dramatic recovery from the Covid-19 pandemic. Thus far, this trend has continued into the 4th quarter. Through the end of November, the S&P 500 is now up 64% from its March 23rd COVID Pandemic low. Over the same period, the Nasdaq, heavily comprised of emerging growth technology companies, is up 79%! The chart below depicts the S&P, Nasdaq, and Dow Jones Industrial Average performance for the year. It does an excellent job of pointing out what appears to be a disparity in outcomes between “old economy” companies represented by the Dow versus their “young economy” company NASDAQ peers. This disparity, of course, is sadly ironic given that the COVID-19 health crisis itself has cut along similar lines. It carries with it financial, social, and political consequences that we will be contending with for years to come.
Figure 1: Performance Comparison 2020 (11/30/2020)

Surprisingly, the Dow fell further than the S&P and Nasdaq into the crisis and has also been slower to recover. This fall mirrors the pandemic itself, which has been much harder on the older segment of society than the young. Likewise, the market has been much harsher on more mature sectors of the economy while leaving the young, faster-growing technology companies, representative of the NASDAQ, relatively unscathed. This phenomenon runs counter to what investors have come to expect from the equity markets during periods of heightened volatility.
Typically, high flying, higher P/E growth companies are often the first to fall back to earth during corrections, as investors flee their names for the safer shores of traditionally defensive sectors of the market like Utilities. Until just recently, this has not been the case. Surprisingly, High dividend-paying stocks lagged dramatically through the recovery. Though perceived as an attractive alternative to low yielding bonds, the dramatic reduction in interest rates was not as advantageous as younger higher growth companies. High growth companies are rewarded in lower interest rate environments as that future growth is discounted back to a higher present value than when rates are higher. The low rate environment works to justify their higher stock prices. Making matters worse, the employees of “old economy” companies, and those employed in the service sector, have seen their lives dramatically impacted from both the risk of the virus as well as the government’s response. For example, when job losses were at their recent peak, wage growth in the U.S. went up, not down, indicating that most jobs lost were lower paying.
On top of being extraordinarily unfair and tragic, this outcome has also likely been very frustrating for traditional value investors on the investment front. After lagging the growth crowd during the entirety of the great recession recovery, they were doubtless anxious to show their wares during an environment that typically would appear to be more favorable to them (Figure 2).
Figure 2: The Value vs. Growth Divide as of 11/30/2020

As you can see from the chart, growth has been handing it to value for some time. Perhaps, most notable is that value strategies of all stripes are still down on the year. Recently there have been some early signs that growth’s market leadership may be changing. The scientific community has done a tremendous job with three drugmakers, Pfizer, Moderna, and AstraZeneca, successfully developing vaccines well ahead of schedule. Clinical trials have shown all carry very high efficacy rates and, so far, limited side effects. This development, which represents the beginning of the end of the COVID-19 pandemic, has given investors the comfort to return to the broader economy equity markets and result in a pivot in market leadership. As a result, value outperformed growth across the board in November and the 4th quarter. A promising sign for many reasons.
At Alamar, we believe a stock market where many companies find success much more favorable than a narrow market only rewarding a few. As we have stated several times in the past, we are wary of equity markets driven by just a few FAANG names, as they result in too many investors leaning on them for returns. In our experience, these types of crowded trades eventually end badly. An environment that rewards many economic sectors relative to a few is a sign of a healthier market and economy.
Additionally, the equity markets have reacted favorably to the end of the uncertainty associated with the recent election season. Perhaps most specifically, equities have responded favorably to the lack of materialization of a heavily predicted Democrat blue wave mandate for change. Because of this, there is a good chance that the Biden administration will face challenges to fulfill some of its more aggressive Campaign promises like selective tax hikes. These two outcomes, the recent arrival of a vaccine and the end of the elections, have combined to squeeze more uncertainty out of the stock market. It is also likely that they have helped to settle some frayed investor nerves. However, we are aware that many remain skeptical.
Their skeptical view brings us to another topic that we would like to discuss with the rest of this letter. In many of our recent conversations, we have noticed a recurring theme or a prevailing view that given how badly things have gone in 2020, it just seems irrational for the stock market to have done so well. Completely understandable, but we want to share some views on this, which might seem to be a bit counterintuitive at first, like the tech sector’s big run this year.
WHERE’S THE PUCK
We should forgive investors for thinking the equity markets should still be down big this year. In our lifetimes, we cannot recall a period in which we were confronting so many simultaneous challenges and so much uncertainty. In just nine months, we have encountered a global health pandemic, the shuttering of the worldwide economy, the loss of more jobs than any period since the great depression, and the sharpest market decline in recent memory. In the U.S., we have experienced a less than stellar response to the crisis by our government leaders of all stripes, not to mention a genuinely uncivil election season. At present American citizens are openly questioning their safety at the police’s hands, while others question the lunacy of a defunded police force. Lastly, we have watched these issues unfold while being locked into our homes. At times, this can feel like just too much. The chart below aptly summarizes this sentiment. It depicts Real GDP Growth dating back to 1960. A period of time that experienced eight separate recessions highlighted in grey, with the first seven do an outstanding job of putting the most recent 8th one into perspective.
Figure 3: Historical Real GDP 1960-2020

After stalling in the first quarter, GDP fell an unprecedented -9.2% in the second quarter and a further -2.9% in the third, in the first planned recession in U.S. history. The economic shutdown’s orchestrated nature enabled an almost immediate response, with massive ensuing monetary and fiscal stimulus. This quick response was unusual in that historically; it is often difficult to determine precisely when the U.S. economy enters a recession, defined by two sequential negative quarters of GDP growth. Due to this, there is typically a delay in our federal response, making the recent recession unique. The sharp decrease in GDP was terrifying, though, no matter how you want to look at it. And it certainly does not look like an environment that equity markets would perform well. Interestingly, when you take the same GDP data as before and layer the U.S. Equity markets’ performance over the top of it, this outcome grows more likely as we begin to see the forward-looking nature of markets.
As you can see from the graph, even though we are inclined to look for one, there does not appear to be a connection between stock returns and GDP. In the most recent correction, U.S. Stocks were up in the second quarter by 12.6%. In the same quarter that GDP was down -9.2%.
Figure 4: ALL US STOCKS vs. GDP 1960-2020

Looking back over prior years, this does not appear to be an anomaly. There is a statistical measure that we can use to test what our eyes are seeing, known as regression analysis. It allows us to attempt to measure the relationship between two independent variables., in this case, stocks and GDP. For example, regression analysis can be utilized to determine whether there is a correlation between GDP growth or contraction and stock prices and how strong that relationship is. A correlation of 1 conveys a strong positive relationship, or in other words, if GDP increases, so do stocks. While -1 indicates a strong inverse relationship, meaning that if GDP increases, it is likely that stocks go down. Lastly, a correlation of 0 indicates no real relationship at all. We conducted a regression analysis on GDP’s connection to US Stock prices over the 60 years, and the results are displayed below.
Figure 5: Correlation of US Stocks VS GDP 1960-2020

The data shows that the correlation between the current quarter for stocks and the same quarter for GDP is -0.05, which indicates no relationship between the two variables. The present quarter stock market return must be plotted against GDP one quarter in advance to achieve a small correlation (.12 on the chart). Plot the same stock return against GDP 2 quarters in advance, and the correlation increases further to .23, a still-fragile relationship, and so on. There are better predictive variables to compare stock returns against than GDP – we like earnings growth and free cash flow. However, the chart and regression analysis speak to the forward-looking nature of markets in its attempt to predict the future. All-time hockey great Wayne Gretzky once famously said, “I skate to where the puck is going, not where it has been.” As investors, we would be wise to follow his lead because overly fixating on the present will likely result in missed opportunities.
SUMMARY
The market has staged a dramatic recovery in the latter part of 2020 thus far. With low-interest rates and a transition in the economy to a remote working environment, less capital intensive and higher growth technology businesses have thrived. Meanwhile, the relatively safe, slower growing, and lower P/E names that we think of in times of crisis have until just recently, have lagged their higher growth peers. This recent pivot towards value is a good sign as it reflects a healthier economy. It also shows investors looking forward beyond the recent elections and towards a world with a vaccine for the virus.
It is understandable to question the markets run given the economic environment, though instructive to understand the pockets that have experienced the lion’s share of the appreciation and why. Additionally, the correlation between heavily scrutinized figures like GDP is a poor measure of near-term stock market performance. Like Gretzky, the market is much more focused on where the puck is going than where it has been. However, there is a current surge in the number of those sick with the coronavirus. The arrival of at least three highly effective vaccines, gives us much to be thankful for and a future in which to be optimistic! Something for all of us to reflect upon as we live in real-time through some challenging circumstances.
Lastly, we would like to share a quick update on Alamar. For those of you who are clients, we are very grateful to have you investing alongside us on this journey. Though we initially underestimated the impact of the COVID-19 crisis, we were nonetheless well-positioned and have had an excellent year. We have a propensity to identify and invest in companies in the earlier stages of their lifecycle, many in technology. As we have stated, this has been a real sweet spot for the market this year. Our flagship Alamar Equity strategy is up 30.6% net of fees through November, handsomely exceeding our expectations as well as our benchmarks on the year (Russell 3000 +15.7% / S&P 500 +14.0%). The considerable outperformance this year has added to our lead relative to the market since inception. Since our inception on January 1st, 2010, the Equity strategy is up 16.7% annualized net of fees, while the Russell and S&P are up 13.4% and 13.6%, respectively. Also, to share a bit more good news, we are delighted to report that our strategy was recently awarded a highly coveted 5-star rating by Morningstar, a database covering separate account managers such as ourselves. We would be happy to share this report with you upon your request. Much to be thankful for indeed.
Please continue to stay safe and healthy –
Best regards,
John Murphy, CFA
DISCLOSURES
The views expressed in this note are initially published and are subject to change without notice. Alamar has no obligation or duty to update the information contained in this note. Past performance is not an indication of future results. Risk is inherent in investments and involves the possibility of loss. Net of fee performance is calculated using the highest fee. The Russell 3000 Index measures the performance of the largest 3000 U.S. companies representing approximately 98% of the investable U.S. equity market. The S&P 500 Index, which is a market-capitalization weighted index containing the 500 most widely held companies chosen with respect to market size, liquidity, and industry.
This publication is made available for informational purposes only and should not be used for any other purpose. This report should not be construed as a solicitation of an offer to buy or sell any security. Information contained herein was obtained and derived from independent third-party sources. Alamar Capital Management, LLC believes the sources are reliable; however, it cannot guarantee the accuracy of such information and has not independently verified the accuracy or completeness of such information.
This publication, and the information contained herein, may not be copied, reproduced, republished, or posted in whole or in part, in any form or media without the prior written consent of Alamar Capital.
ACM Commentary 2Q 2020
While it’s only been six months into a new year, it seems like a decade has gone by! To say this year has been full of surprises would be a severe understatement. Even in our worst nightmares we are unable to dream up a sequence of – a worldwide pandemic, racial divisions & protests, severely disparate health outcomes from the pandemic crowned with inept leadership in response to the rolling crises! We sincerely hope you and your loved ones are staying safe and well during these tumultuous times.
This is our third crisis since we began our investing career over two decades ago. First was the technology & telecom bubble and subsequent crash in the late 90s, followed by the housing and financial crises of 2007-2009. Now we face a healthcare and societal breakdown driven by the SARS-COV-2 virus. This crisis is much worse than the others because of its speed and the large number of fatalities primarily driven by unpreparedness and incompetence. Even now, over six months into the pandemic, policy makers are still stumbling around with no cogent response.
One thing that has not changed this year is the narrowness of the US stock market, driven primarily by FAMAA (Facebook, Amazon, Microsoft, Apple and Alphabet). We wrote extensively about this phenomenon in the past and will not belabor the point in this note. The S&P500 was down 3% in the first half of this year, but excluding these five names, the market would be down over 11%! This stark difference in performance, in our opinion, explains in large part, the divergence between the dismal state of the real economy and the optimism of the stock market. As you are aware, our portfolios have performed very well this year despite not investing in these crowded investments.
Like many of you, we have spent an inordinate amount of time in the last few months reading and trying to understand the science and progression of COVID-19. In this note we will share some of the results we find interesting. We will close with some general observations of the investing landscape as we see it midway through this very consequential year.
Also noteworthy – we moved into new offices earlier this year (a few blocks from our old location) and our registration with the SEC went into effect a few days ago. Clients all over the country can now utilize our services.
COVID-19: THE GOOD, THE BAD & THE UGLY
In this section we will attempt to distill what we know about the virus (SAR-COV-2) and the resulting disease (COVID-19). We will also provide references so you can verify all of our statements. As much as possible we have ignored the media, the so-called TV-pundits and politicians but instead relied on published science. Needless to say, this is a novel virus and scientists continue to unearth new findings. We are nowhere close to fully understanding the long-term effects of this pandemic.
The good news about this disease is that with a few simple steps and good leadership it can be controllable. Countries such as China, Australia, South Korea and Singapore have shown how it is done. Even countries such as Spain and Italy that were caught by surprise and entirely unprepared have now brought the disease spread under control.
Figure 1 plots the new cases (7 day average) and deaths (7 day average) in Italy since the onset of the pandemic. As you can see, Italy was overwhelmed by cases at first and was on the front page of the news daily in March and early April. Cases peaked in late March followed by deaths a week later and since then both have trended down. The figure for Spain, another country hit very hard early on by the pandemic, looks similar.

After being taken by surprise and overwhelmed by the rapid speed of transmission, the Italian government instituted full lockdowns of certain cities to slow the spread. Obtaining reliable and current data on outbreaks allows governments to stamp out the viral fire.
Unfortunately, here in the US the threat detection and responsiveness continues to disappoint, even now, six months into the crisis. Figure 2 plots the same statistics for the US.

As seen in the plot, the US did not experience the rapid onset of cases until two weeks after Italy, beginning mid-March. Since then the virus continues to spread, primarily due to haphazard, uncoordinated leadership. Hotspots flare up followed by a temporary, porous lockdown but the virus quickly reemerges with more strength once the restrictions are lifted. Death numbers came down but are now trending up after bottoming at roughly 500 a day.
After surveying the responses of various countries and reading papers in scientific journals, we are optimistic of the disease prognosis. Here are a few of our observations:
The disease can be brought under control with the implementation of the right policies (see Italy, Spain and the State of New York).
Even after bringing it under control the virus cannot be fully eradicated. Despite the success of countries such as Singapore and South Korea, they continue to see small viral outbreaks. We will need persistent, eternal vigilance.
Wearing simple cloth masks does reduce the spread of the virusi.
Even though the symptoms initially manifest in the lungs – giving rise to difficulty breathing for instance – the disease seems to primarily affect the cardiovascular systemii.
Cardiovascular disease, obesity, sickle cell disease, cancer and Type 2 diabetes are the biggest associative comorbidity factorsiii. This finding is in accord with the prior observation.
The case fatality rate (CFR) increases exponentially with ageiv.
The case fatality rate disproportionately impacts Blacks and Hispanics in the USv.
Neutralizing Antibodies (nAb) produced by the body in response to an infection seem to dissipate within 100 days.vi Hence we are likely to get reinfected with the virus.
A simple color coded website, constantly updated by the CDC, showing county-level infection and fatality data, could bring pressure on counties to bring infection rates under control. For instance, see the website maintained by Harvard University – https://globalepidemics.org/key-metrics-for-covid-suppression/
We conclude, based on the evidence so far, the virus that induces COVID-19 will be with us for a long time. It will be very difficult to completely eradicate. The virus will likely mutate over time as influenza viruses do. However, as in all prior pandemics, we can, with the right policies, bring the current one under control.
INVESTMENT OUTLOOK
While we did not anticipate the onset of this pandemic at the start of this year, we were nevertheless well positioned coming into the crisis. Many of our long-term investments have done very well this year such that we are comfortably ahead of market benchmarks. Moreover, we took advantage of the selloff earlier this year to initiate new positions in companies that were on our radar for many years.
The trend toward passive investing continues unabated and this year in particular has seen a dramatic acceleration. As we have noted in the past, passive investing leads to the larger weighted companies in an index garnering a disproportionate share of investor dollars. All else equal, these flows lead to share prices of larger names rising faster than the rest which in turn attracts more investor attention – a self-fulfilling cycle of riches! This year provides clear evidence of this phenomenon. The market, as defined by the S&P500, is down 3%. Remember, exclude the top five names (FAMAA) and the remaining 495 stocks are down 11%! FAMAA as a group is up 32% this year. Investors without these five names in their portfolios most likely have severely underperformed the market. This phenomenon continues throughout the capitalization spectrum. Take a look at Table 1 below –

The table clearly shows the effect of passive investing on the market. The highly weighted names (Top 10) are up almost 10% while the bottom decile is down almost 40%. In fact the returns are well correlated with size decile. As flows get invested in the larger names valuations get pushed up as seen from the various metrics – Price/Earnings (P/E), Price/Sales, Price/Free Cash Flow (P/FCF) and Price/Book. All these metrics show a similar trend – the top capitalization deciles are more expensive than the bottom ones. Our investment sweet spot is usually in the range of $5 Billion to $50 Billion in capitalization. The median market cap of the Alamar portfolio at the end of June was $13.5 Billion, the 7th decile of Table 1. Despite falling in the higher decile and not holding any of the FAMAA stocks, we have comfortably beaten the market so far this year.
Looking forward, we expect the investment landscape to change considerably as we work through the after effects of this crisis. Industries such as hotels, retail stores, large office buildings, dense apartment complexes, restaurants and more will be severely impacted. Financial institutions with large exposures to these industries will also be under scrutiny. As discussed, the dramatic difference in health outcomes of the poor and minorities in particular will most likely engender a societal response. We are already seeing the initial steps being taken. Health care and delivery will be under scrutiny. The CDC and the FDA were caught unprepared when the virus arrived. Personal Protective Equipment (PPE) was unavailable and lack of testing capabilities handicapped an effective response. We expect government at all levels to invest in healthcare infrastructure to avoid a recurrence. As in prior crises and recoveries, we expect investment opportunities to arise and we will be on the lookout for well managed companies at reasonable valuations.
CONCLUDING THOUGHTS
This year will be remembered for generations. A worldwide pandemic caught us severely unprepared. The lack of investment in healthcare infrastructure, inadequate information systems and poor, confusing leadership resulted in a chaotic response. While we are still attempting to comprehend the outbreak, other countries have already brought the disease under control.
The stock market, on the surface, seems disconnected from the damage to the real economy. However, a look under the hood shows wide disparities. A few popular names are driving all the returns while the vast majority of stocks are falling behind. As in the past, great investment opportunities present themselves during times of crises, and we are on the lookout to invest in them.
Thank you for your continued trust and confidence in Alamar Capital Management.
Sincerely,
George Tharakan, CFA
george@alamarcapital.com
Disclosures
The views expressed in this note are as of the date initially published and are subject to change without notice. Alamar has no obligation or duty to update the information contained in this note. Past performance is not an indication of future results. Risk is inherent in investments and involves the possibility of loss.
This publication is made available for informational purposes only and should not be used for any other purpose. In particular, this report should not be construed as a solicitation of an offer to buy or sell any security. Information contained herein was obtained and derived from independent third-party sources. Alamar Capital Management, LLC believes the sources are reliable; however, it cannot guarantee the accuracy of such information and has not independently verified the accuracy or completeness of such information.
This publication, and the information contained herein, may not be copied, reproduced, republished, or posted in whole or in part, in any form or media without the prior written consent of Alamar Capital.
i Wang Xiaowen, Bhatt D, et al. Association Between Universal Masking in a Health Care System and SARS-CoV-2 Positivity Among Health Care Workers. JAMA April 2020
ii Wadman Meredith, Matacic C, et al. Rampage through the Body. Science April 2020 VOL 368 ISSUE 6489
iii Maurizio Cecconi MD, Giacomo Grasselli MD, et al. Baseline Characteristics and Outcomes of 1591 Patients Infected With SARS-CoV-2 Admitted to ICUs of the Lombardy Region, Italy. JAMA April 2020
iv Integrated surveillance of COVID-19 in Italy. Department of Infectious Diseases Govt of Italy https://www.ecdc.europa.eu/en/publications-data
v Jonathan M. Wortham, MD et al. Characteristics of Persons Who Died with COVID-19 — United States. CDC MMWR July 10, 2020
vi Katie J Doores et al. Longitudinal evaluation and decline of antibody responses in SARS-CoV-2 infection. medRxiv preprint July 11, 2020
ACM Commentary 1Q 2020
MARKET COMMENTARY
It is hard to fathom that just 6 weeks ago, on February 19th, the U.S. stock market reached an all-time high when S&P closed at a record 3,386. Of course, a lot has transpired in the weeks since, leaving most of us sheltered in our homes, dealing with the simultaneous health worry associated with the Coronavirus, as well as its financial impact. Additionally, we have voluntarily shuttered the economy, a very large and slow-moving ship, to attempt to mitigate the impact of the virus. This combination makes our current crisis akin to a war, which is why the recent correction is different than the great recession, or dot com bubble, and why we find ourselves in such unchartered waters. None of us have lived through anything like this before, and if the market dislikes anything, it is uncertainty. Understandably, the markets have experienced near unprecedented volatility in the days since, as investors have grown increasingly aware of the size and the scope of the challenge before us. The market has fallen in a matter of days and weeks in an amount that typically has taken months and even years in prior bear markets. In fact, the current correction, rivals only the market crash of 1987 when it was down -31% in just 14 days. However, it has been said that the first victim of a crisis is perspective, so it is also important and instructive to look at the gains in the market over the past decade, particularly considering the alternatives like cash.
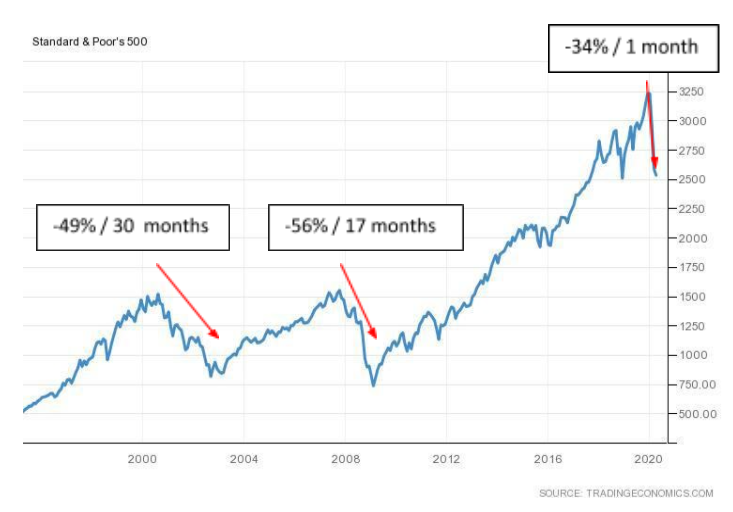
Much of the data necessary to measure the virus’ impact on the economy, as well as our investment positions is still unknown. With each passing day, more companies remove future guidance on the performance of their businesses as a result of the Coronavirus. Additionally, as we do get into first quarter earnings season this week, as January and February did not reflect the pandemic crisis, it is only the month of March that will help inform the economic damage caused.
What we do know now, is that the market’s reaction to the Coronavirus and subsequent shut down of the economy has been both violent and indiscriminate. Down -19.6% the S&P experienced its worst quarterly return since 1938. A traditional 60/40* allocation provided a bit of ballast to returns generating a loss of -12.6% in the quarter. Other than government bonds and cash, there was nowhere to hide from the market’s turmoil. Spreads widened causing proportional losses across the fixed income risk spectrum, and even traditionally defensive sectors like utilities, staples, and health care saw meaningful losses. The energy sector, for its part, was down -51% in the quarter. A victim of a double whammy of a massive reduction of demand as the economy was halted, and a huge influx of supply as both Saudi Arabia and Russia engaged in a price war and flooded the market.
As for Alamar, our stock portfolio fared better than the broader markets with our equity portfolio posting a -18.6% return for the quarter. In response to the crisis, we have rebalanced our stock portfolio to free up cash and to help us handicap against the uncertainty of COVID and the possibility of policy response errors.
On the Alamar Wealth front, we have been taking advantage selectively in taxable accounts to harvest losses and replace with like positions. We foresee slowly working towards rebalancing accounts back to target risk levels, where appropriate, overtime. However, hard earned lessons from prior market corrections have taught us that there are often a few false starts before a sustained recovery. Of course, time will tell.
Equally dramatic as the recent market volatility, has been the monetary response from the Federal Reserve and the fiscal response by the Senate to the crisis which has been similarly dramatic and unprecedented. In response to the pandemic and in reaction to the stay at home orders shuttering the economy, the Fed has stepped in to offer near limitless and in some cases unprecedented resources to act as a lifeline to support the credit markets and businesses. The Fed’s response has been extensive and will have eventual repercussions. We will discuss it in greater detail in a future commentary. A good summary on their actions can be found here.
To head off the damage, and in an encouraging bipartisan fashion, Congress has responded with three legislative actions, or phases. First, on March 6th it passed a bill providing $8.3 billion in support of U.S. public health to assist with the development of vaccines and additional medical supplies and resources. Second, on March 10th the Families First Coronavirus Response Act was passed to provide relief for both employers and employees who were affected by COVID-19. This legislation is intended to directly combat the virus and cushion those affected by funding sorely needed additional testing, funding sick leave for many workers, and providing funds to states via Medicaid funds. Phase three of the legislative response was enacted on March 27th with the passage of the Coronavirus Aid, Relief and Economic Security Act (CARES). At an expected cost of $2.2 trillion, or 10% of US GDP, it is structured as a bailout and stimulus package to aid industries suffering from the pandemic and provide economic relief to families and small businesses who are suffering. Specifically, the bill authorizes emergency loans to distressed businesses and provides funding for forgivable bridge loans. The bill also provides funding for $1,200 tax rebates to individuals, with additional $500 payments per qualifying child. The rebate begins phasing out when incomes exceed $150,000 for joint filers. Additionally, the legislation suspends federal student loan payments. In a further backstop the bill authorizes the Department of the Treasury to temporarily guarantee money market funds. With the House and Senate now both adjourned, discussions are already underway on both sides of the aisle about the need for an additional Phase 4 of stimulus.
It has been estimated that the combined response totals as much as $4 trillion in stimulus (20% of GDP). The offsetting impact of both monetary and fiscal policy efforts to support the economy is currently unknown, as it is difficult to project how much of the stimulus gets to the underlying economy. Once there, it is equally difficult to predict the extent to which it will dampen the blow of the temporarily shut down. Current projections for the US Economy expect a contraction of 25-35% in GDP in the second quarter, with some anticipating an expansion of as much as 19% by the 3rd quarter. While there is a risk that we remain closed longer than anticipated, and a longer-term fallout on income and spending persists, the aggressive action by the Fed and government has surely helped to contain this. The stock markets recovery in the later part of March and into April (+20%) reflects this.
At Alamar our crystal ball is blurry, and we are not particularly good at reading the tea leaves. Though, like you, we have been reading everything we can get our hands on about the virus. We are less inclined to try to trade our portfolio to market time the peak number of cases of COVID-19. Nor are we interested in identifying stocks that might in the short term see a tail wind from the crisis. Our experience has taught us that a crisis is not a good time to experiment with your skill set. We remain focused on the long term and identifying businesses that we can own for several years down the road.
However, no investor is immune from the challenge that the Coronavirus presents because it has fundamentally changed our understanding of the world in which we live. Consumer behavior will likely change due to the economic impact, as well as our concern for our physical safety – at least for a period. Businesses will be forced to respond and not everyone can be saved; those companies that have the strongest balance sheets carry with them considerable advantages over their more cash strapped peers.
At Alamar, we are hard at work addressing these issues, particularly as they apply to our portfolio of investments, and when looking at alternatives. Where there is more uncertainty, we must increase our margin for error. Likewise, the market’s correction has allowed us to identify and invest in companies that we have admired for many years at very attractive prices. Fortunately for us, we believe this type of analysis is much easier to perform at a more granular level, one company at a time, as opposed to through the ownership of an index. We strongly believe that opportunity will continue to present itself in the weeks and months ahead, but of course much uncertainty remains. Considering your own personal investment time horizon and risk tolerance level is never a bad idea, and something that we encourage.
COVID SUMMARY
Of course, in time we will prevail and overcome this crisis. American ingenuity is hard at work. It is just a question of how long it will take to secure more testing, immunotherapy treatments and eventually a vaccine. In the meantime, we have learned that we can buy more time for ourselves and reduce the burden on our healthcare system with the only current arrow in our quiver – social distancing. These efforts appear to be working to “flatten the curve”, as new cases have begun to decelerate where it has been practiced. In the U.S., this has resulted in the Institute for Health Metrics and Evaluation to reduce their guidance for deaths twice this week alone and now project 31,000 to 127,000 deaths. Though still tragic, this is a much lower figure than their original projections.
With a reopened economy we will then gain an understanding of the degree of the damage, and the extent to which habits have been changed. With the benefit of hindsight, the U.S. and greater Europe have been slow to respond to the COVID-19 pandemic, and we are paying the very real consequences. Surely, we will come out of this challenge with more resolve and much better prepared and more informed to combat future viruses. The graph below, provided by Our World in Data, displays a view of the effectiveness of the global response to the virus to date. It depicts the growth of the virus in each country upon confirmation of the 100th case.

The United States is the red line above France, and unfortunately does not fit on the chart. We currently have the most Coronavirus cases in the world, with over 600,000 as of this writing. Contrast this with Asia’s Coronavirus response, where countries like South Korea, who reported their first case on the same day as the United States, is being held out as a model for early action and aggressive containment. Both were hard hit by the SARS epidemic in 2003, and their leaders vowed to build up national capabilities and regional coordination to respond rapidly and effectively to future pandemics. Subsequent outbreaks of H5N1 and H1N1 avian influenza reinforced their focus on pandemic preparedness. As you can see, many Asian countries who intervened quickly have already seen their curves flatten. Italy, a global hotspot provides a glimmer of hope. Another late adopter to containment efforts, they are beginning to show some signs of improvement for their efforts, as their daily number of new cases seems to be slowing.
The next chart from the same source shows the much talked about testing effort. Again, South Korea has proven very quick to react and Italy has done an admirable job escalating their efforts.

Fortunately for the U.S., these countries with both prior experiences dealing with earlier virus epidemics and who are further along the curve dealing with this crisis provide a reference point. We would be wise to leverage their experiences and best practices to our benefit.
We hope this email finds you safe and sound and enjoying some newfound time with your families.
Thank you for your time and continued consideration –
John Murphy, CFA
Perhaps, some useful resources:
Harvard Business Review / Lessons from Italy’s Response
The Institute for Health Metrics and Evaluation (IHME) Projections
Our World in Data Trusted Resource
DISCLOSURES
The views expressed in this note are as of the date initially published and are subject to change without notice. Alamar has no obligation or duty to update the information contained in this note. Past performance is not an indication of future results. Risk is inherent in investments and involves the possibility of loss. Net of fee performance is calculated using the highest fee. The Russell 3000 Index measures the performance of the largest 3000 U.S. companies representing approximately 98% of the investable U.S. equity market. The S&P 500 Index, which is a market-capitalization weighted index containing the 500 most widely held companies chosen with respect to market size, liquidity, and industry.
This publication is made available for informational purposes only and should not be used for any other purpose. This report should not be construed as a solicitation of an offer to buy or sell any security. Information contained herein was obtained and derived from independent third-party sources. Alamar Capital Management, LLC believes the sources are reliable; however, it cannot guarantee the accuracy of such information and has not independently verified the accuracy or completeness of such information.
ACM Commentary 4Q 2019
Last year was a stark contrast to the prior year. While all asset classes declined in 2018, investors enjoyed a bounty of riches in 2019 – every asset class produced positive returns. Corporate profits, on the other hand, exhibited the converse phenomenon. In 2018, S&P500 profits were up 21.7% largely due to tax cuts, while in 2019, profits are expected to barely grow.
Since Alamar’s inception 10 years ago, we have matched the S&P500 performance of 13.6%. In 2019, the S&P500 returned 31.5% while our equity strategy was up 22.5%. It’s important to realize that we have accomplished this performance while taking less risk. We have held roughly 10% cash on average during the entire 10-year duration. Moreover, as we have written several times in the past, a large portion of the market performance has been driven by just a few stocks: FaceBook, Apple, Alphabet, Microsoft and Amazon (FAAMA). For instance, these 5 stocks were responsible for 24% of the performance of the S&P500 last year. FAAMA now makes up 21% of the index. We have never owned these stocks in our equity portfolio since we prefer to avoid crowded, fashionable investments.
We are optimistic about the US economy in this election year as it seems a number of uncertainties overhanging the market have been or will be resolved. One of the largest has been the restrictive monetary policy of the US Federal Reserve at the end of 2018. The Federal Reserve has now switched from a restrictive to an accommodative stance. We will explore these subjects in this note.
IS THE FEDERAL RESERVE JUICING THE MARKET?
One of the criticisms we hear is that money printing by the Federal Reserve is finding its way into the stock market. To put it more bluntly, the Federal Reserve is pumping up stock prices; if the Federal Reserve stopped expanding the balance sheet, stock prices would decline.
We went back and looked at money flows into the domestic stock market to see if there is any evidence to back this claim. If the money printed by the Fed was pushing stock prices up, we would expect to see large inflows of cash into the market. Table 1 depicts flows into mutual funds in the major asset classes over the last 10 years. In fact though, money has been flowing out of domestic equity funds with relative consistency over the last decade and into bond funds instead. One possible explanation could be that Fed influence is transmitted through passive vehicles such as ETFs instead of mutual funds. Table 2 depicts flows into ETFs over the same time period. While ETFs have attracted funds away from active vehicles, the amounts involved are too small to meaningfully impact a stock market worth over $30 Trillion. Moreover, the combined impact of mutual funds and ETFs last year was an outflow from equities of almost $200 Billion. Investors have been allocating funds away from equities into income producing assets such as bonds.

In addition, the relationship between the size of the Fed balance sheet and the level of the US stock market is very weak. In our opinion, equity prices are moving higher because investors perceive economic fundamentals will improve going forward. We will elaborate on what we see in the earnings landscape in the next section.
HAS THE CYCLE BEEN EXTENDED?
From the time Alamar began operations in 2010 economic prognosticators have been forecasting the end of this economic cycle. The reasons have been manifold, including:
This cycle will be short because the consumer is overleveraged (2010 and 2011)
Too much debt in the economy will place a damper on growth (all along)
Standard & Poor’s downgrades US credit rating
Government shutdown because Congress would not pass the budget
Fed money printing will create inflation leading to stagflation
Fed raising rates will lead to recession
Fed quantitative tightening will drain liquidity from the economy
Yield curve inversion is predicting a downturn (2019)
Revoking NAFTA and placing tariffs on Chinese imports will thwart the economy
Brexit will weaken the UK and Europe in general
Now here we are, a decade later, and the economy is still chugging along, the longest economic expansion in history! In fact, from our surveys, economic growth looks to be accelerating. The month of December was very strong in a number of areas – retail sales, credit card spending, airline traffic, existing home sales and new home sales. Unfortunately, the political landscape hinders our ability to perceive the improving backdrop.
Many of the headwinds mentioned above have abated. The consumer is in excellent shape – the unemployment rate is at a 50-year low, income is rising, savings rates are up and consumer leverage is heading lower. There is no sign of inflation in the economy. Indeed, money velocity has collapsed and deposits are piling up on bank balance sheets. We will discuss this in more depth in a future note. The Fed has stopped raising rates and has reversed the last few hikes. Quantitative tightening has ceased with the Fed now pumping liquidity into the banking system. The yield curve is no longer inverted. NAFTA has been replaced by the USMCA and will soon be in effect after Senate ratification and Presidential signature. China and the US have agreed to a phase 1 deal where China will import an additional $200 Billion of goods and services from the US over the next 2 years. This will undoubtedly reduce the trade deficit and increase US economic growth. After 3 long years, Brexit will now go into effect at the end of the month. Uncertainty of Brexit has now been finally removed and businesses can be more certain of their investments.
Besides removing the headwinds, there are tailwinds building up strength that will, in our view, push the economy further. This year is an election year and there are an unprecedented 3 billionaires running to become President. All will spend hundreds of millions of dollars on their campaigns – staffing, advertising and travel. This will likely be the most expensive election in history – very good news for the economy. The Olympics in Japan this summer will add to the spending binge.
The deployment of the 5th generation of wireless networks is just beginning. New infrastructure, handsets and applications to harness the power of 5G will spur growth for years to come. At Alamar we have already begun investing to capitalize on this theme and are on the lookout to add more investments in the next few years. Entire industries will be disrupted if they do not embrace this technology.
The entire automotive installed base worldwide will switch to electric or hybrid over the next 2 to 3 decades. Governments will be forced to mandate this switch as the repercussions of global warming become evident. Similarly, the utility industry will have to switch from burning fossil fuels to renewables to generate electricity. All these transitions require large outlays by companies, individuals and governments. These outlays will produce enormous opportunities for investors which we hope to capitalize upon in the next decade of Alamar’s existence.
CONCLUDING THOUGHTS
The stock market continues to hit new highs but without investors full participation. Fed money printing is not percolating into the stock market; instead, cash is piling into money market funds, bank deposits and bond funds. Investors are spending much time listening to prognosticators preaching doom and gloom and missing out on a spectacular investment environment.
When investors do decide to allocate to equities, they are more likely to go with what’s popular and fashionable. 2019 displayed a recurrence of an investing trend we identified many years ago – investors piling into a few select names (FAAMA) which in turn drive index returns. Five companies now represent 21% of the market and capture 21% of new investment dollars. While detrimental for us in the short-term, this trend is very beneficial for us in the long run. It is far more difficult to double the value of a company from $1 Trillion to $2 Trillion than from $1 Billion to $2 Billion. We look for opportunities where we can invest at the $1 Billion to $10 Billion stage and go along for the ride as the value rises to $50 Billion and beyond. As our clients who have been with us a long time know, we have been very successful in identifying many such opportunities over the last 10 years. Given the unprecedented opportunities in front of us, we are confident the best is yet to come.
Thank you for your continued trust and confidence in Alamar Capital Management.
Sincerely,
George Tharakan, CFA
george@alamarcapital.com
Disclosures
The views expressed in this note are as of the date initially published and are subject to change without notice. Alamar has no obligation or duty to update the information contained in this note. Past performance is not an indication of future results. Risk is inherent in investments and involves the possibility of loss.
This publication is made available for informational purposes only and should not be used for any other purpose. In particular, this report should not be construed as a solicitation of an offer to buy or sell any security. Information contained herein was obtained and derived from independent third-party sources. Alamar Capital Management, LLC believes the sources are reliable; however, it cannot guarantee the accuracy of such information and has not independently verified the accuracy or completeness of such information.
This publication, and the information contained herein, may not be copied, reproduced, republished, or posted in whole or in part, in any form or media without the prior written consent of Alamar Capital.
ACM Commentary 3Q 2019
MARKET COMMENTARY
Despite plenty of headline risk and relative uncertainty, the market and asset classes of all kinds continued their upward march in 2019. The chart below depicts the performance of various asset classes across the risk spectrum through October of this year.
Figure 1: Market Year to Date Returns Through October

If you threw a dart at risk, you made money so far this year, but of course, charts like this make it all seem far too easy. As the saying goes, markets climb walls of worry, and there has been plenty of fodder for consternation in recent months. It seems though that much has been offset by a falling interest rate environment which has proven favorable for both equity and fixed income markets.
Of big concern for investors has been the escalating trade war between the two largest economies in the world, the U.S. and China. Additionally, we currently have an unconventional U.S. president who is openly critical of the Federal Reserve (Fed) while in the midst of impeachment proceedings. Add to this, growing populist movements, changes in governments in the UK and Italy, unrest in Hong Kong, as well as perpetual uncertainty around Brexit, and the picture grows even more cloudy.
And yet the market continues its rise to all time highs, erasing the losses of 2018 (A year in which every asset class save for cash lost money). This type of market near year end can strikes fear in the hearts and minds of cash heavy individual investors and underperforming professional investors alike, as both grow hungry to participate in the market’s gains. These investors might have a newfound appreciation for risk taking and a newfound willingness to overlook additional market uncertainty – a slowing global back drop chief among them (Figure 2).
Figure 2: Global Growth Forecasts

The Chart above shows the recent and forecasted global growth rates and is provided by the World Bank. Though the ultimate outcome for the global economy remains to be seen, what is growing increasingly clear is that despite their best efforts and massive monetary and fiscal stimulus, the Fed and the European Central Bank (ECB) have not been able to generate much in the way of meaningful sustainable growth. The only real quantifiable beneficiary of central bank policy has been risk-assets. For their part, sovereign debt levels now reside at unprecedented levels and due to anemic inflation and low growth, rates remain near all time lows. In fact, as of today roughly 25% or $17 Trillion of all government debt now trades at negative real rates of return! In many respects, we now live in a world that resides outside of prevailing economic theory that which has been taught in textbooks. Regardless, it is hard to debate that the current very low interest rate environment supports higher market valuations.
An additional bright spot has been the resiliency of the U.S. consumer. Despite slowing manufacturing activity, and reduced capital expenditures by corporate CEO’s consumer confidence remains high, the labor market remains tight and is now beginning to see some wage growth. The chart below shows the comparable quarterly sales growth, or same store sales from Walmart (WMT). As the largest retailer in the world Walmart provides a very useful barometer for the health of the consumer.
Figure 3: Walmart Same Store Sales
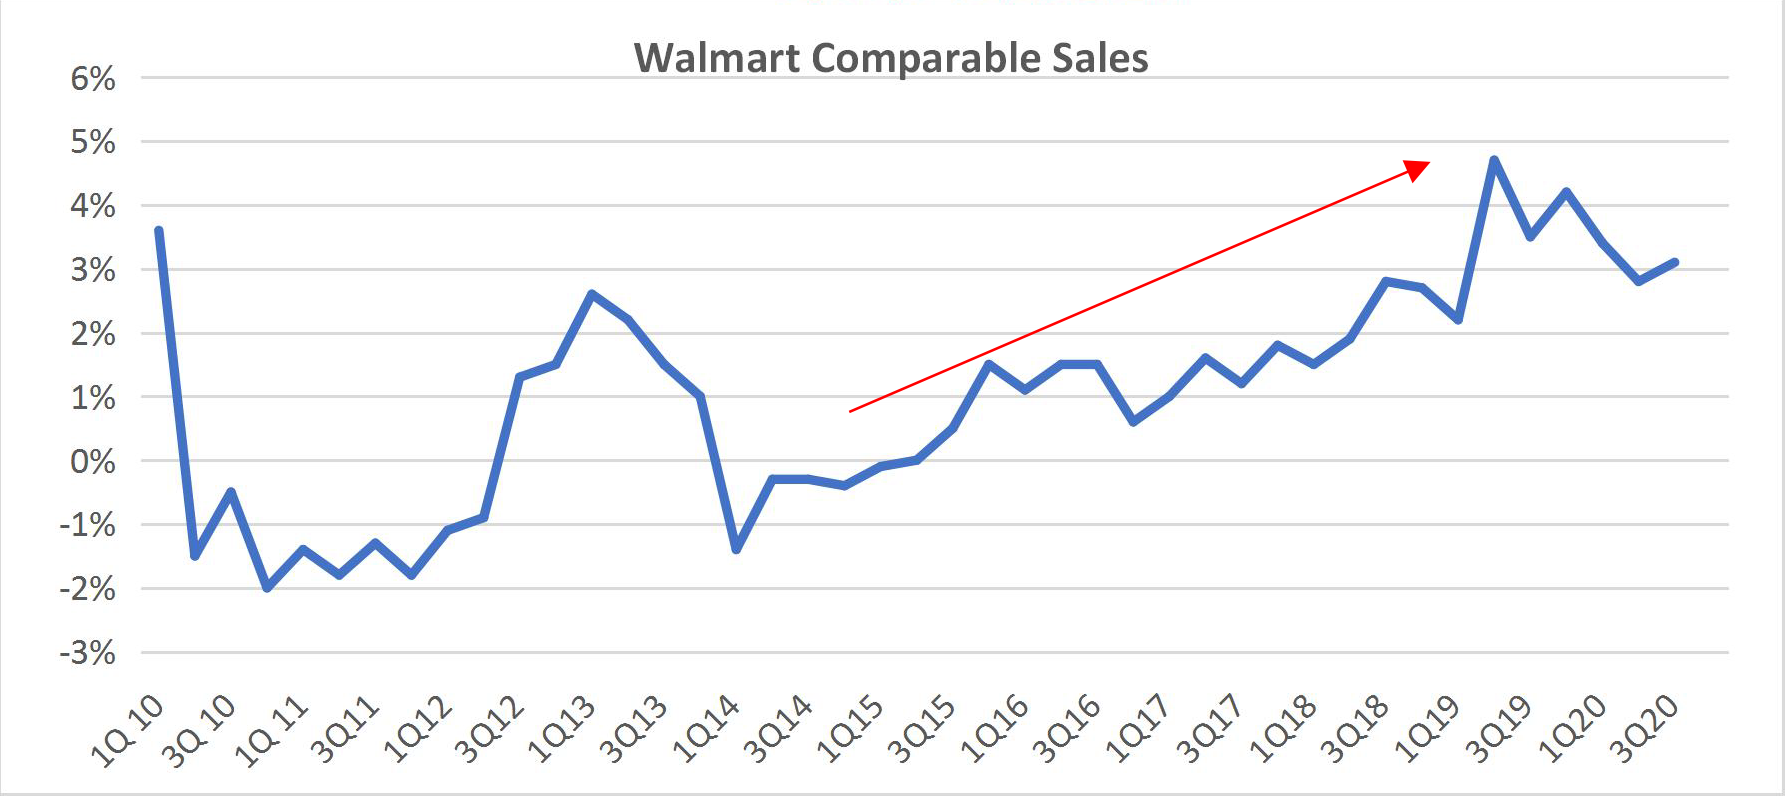
For Walmart, comparable store sales include sales from stores and clubs open for the previous 12 months, including remodels, relocations and expansions. Contrary to the global backdrop, this is an encouraging sign, and it is not unique to just Walmart. Costco (COST) shares recently reached an all-time high due to growing sales. Their comparable sales in the U.S. for the month of October came in at 5.0%, providing further evidence to the strength of the U.S. consumer.
SUMMARY
As is almost always the case, there is plenty for investors to worry about. This year they had to overcome uncertainty and continue to allocate towards risk but have been rewarded so and for that matter, over the past decade. Despite earnings results that have come in far below expectations, the market has exceeded expectations, due in large part, to low rates and accommodative Fed policy. This low interest rate environment seems to support the market at these levels, but there are headwinds, namely slowing global growth and a heavy debt burden. Despite trade risk and slowing manufacturing activity and expenditures amongst corporations, the U.S. consumer remains a real bright spot and with consumer spending representing almost 70% of the overall U.S. economy this is a noteworthy positive.
As for Alamar, we know that investing is a long-term activity. We believe thoughtful exposure to risk that reflects each of our individual risk profiles is the best approach to meeting our long-term goals over time. This approach enables us to stay the course during inevitable disruptions and leaves us pleasantly surprised when our expectations are exceeded.
Thank you for your time and continued consideration –
John Murphy, CFA
DISCLOSURES
The views expressed in this note are as of the date initially published and are subject to change without notice. Alamar has no obligation or duty to update the information contained in this note. Past performance is not an indication of future results. Risk is inherent in investments and involves the possibility of loss. Net of fee performance is calculated using the highest fee. The Russell 3000 Index measures the performance of the largest 3000 U.S. companies representing approximately 98% of the investable U.S. equity market. The S&P 500 Index, which is a market-capitalization weighted index containing the 500 most widely held companies chosen with respect to market size, liquidity, and industry.
This publication is made available for informational purposes only and should not be used for any other purpose. This report should not be construed as a solicitation of an offer to buy or sell any security. Information contained herein was obtained and derived from independent third-party sources. Alamar Capital Management, LLC believes the sources are reliable; however, it cannot guarantee the accuracy of such information and has not independently verified the accuracy or completeness of such information.
This publication, and the information contained herein, may not be copied, reproduced, republished, or posted in whole or in part, in any form or media without the prior written consent of Alamar Capital.
ACM Commentary 2Q 2019
This year started off with a bang for Alamar. Three of our stock holdings were purchased for large premiums. We cannot recall a time when this has occurred over our 10-year history. Given the nature of our holdings – good businesses, growing well, trading at reasonable valuations – we expect more acquisitions in the future.
The stock market continues to be driven by just a few names (FAMAA) as has been the case for the last few years. We believe the continued inflow of investor dollars into passive indices is one of the drivers of this phenomenon. The outsized investor attention on a few companies leaves plenty of fine investments trading at reasonable prices. Our goal is to fish in these unloved waters to replace the investments that have been acquired from our portfolio.
On the surface, the stock market and the bond market are signaling different future trajectories for the US economy. In this note we will dig deeper to describe what we see. To cut to the ending, we do not see a recession in the horizon despite some storm clouds.
WHAT DOES THE BOND MARKET FORECAST?
One of the market indicators we look at is the treasury yield curve. As discussed in prior writings, an inverted yield curve typically signals the onset of an economic contraction as bond investors predict lower rates in the future. Figure 1 depicts the spread between the 2 year and 10 year maturity Treasury bond.
Figure 1: Treasury Yield curve spreads

The spread is clearly pointing in the direction of an oncoming slowdown. Indeed some portions of the yield curve, such as the 2 year – 3 month spread, have already inverted. Market expectations of an imminent cut of the Fed Funds rate by the Federal Reserve could be driving this phenomenon.
However, there are other sectors of the bond market that do not portend a slowdown. One of the indicators we follow is the spread of corporate bonds – both Investment Grade and non-Investment grade – to comparable Treasuries. If a slowdown or recession is imminent, investors would demand higher yields to compensate for the increased risks. Figure 2 plots investment grade corporate bond spreads.
Figure 2: Investment Grade Corporate spreads
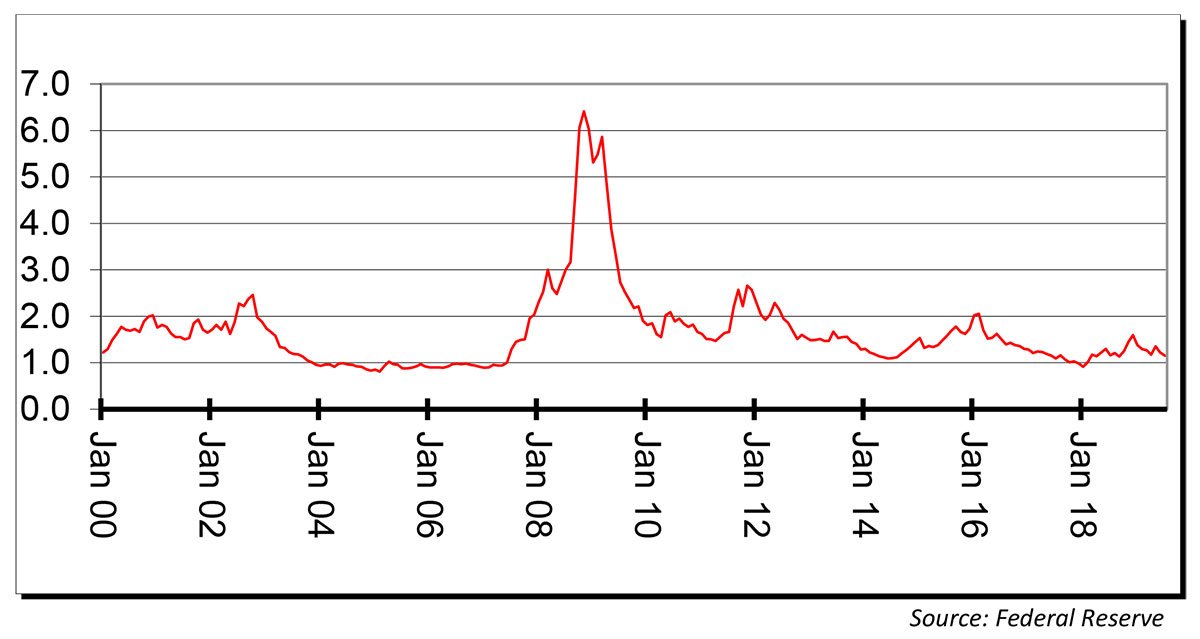
The spreads are not widening in anticipation of a recession as they did back in 2000 and 2007. In fact the spreads are lower now than in early 2016 and the trend line is falling further. Non-investment grade corporate bonds are affirming the same conclusion. Figure 3 depicts Non-investment grade spreads.
Figure 3: Non-Investment Grade Corporate spreads

We conclude from these observations that the bond market is not signaling the onset of a recession. Instead the market is expecting one or more rate cuts from the Federal Reserve since the real interest rate (Fed Funds minus inflation) is quite high. With the inflation rate tracking towards 1.5% for the year, we think the Fed can lower short-term rates by 50bps or more, particularly since economic growth is anemic.
EQUITY MARKET
In contrast to the yield curve, the US stock market is close to an all-time record high as of this writing. Investors are looking past the economic weakness from trade disruptions and tepid manufacturing readings. Our internal surveys of economic conditions, particularly in housing and autos, show pronounced weakness. However, this is offset by very strong growth
in consumer spending, robust domestic air travel and double-digit growth in credit card spending reported by large card-issuing banks such as JP Morgan and Capital One.
Credit quality is very good as measured by delinquencies and loan write-offs. The US consumer is enjoying low unemployment and rising wages while at the same time inflation is rising very modestly – the ingredients of a goldilocks economy. Indeed there are now more job openings than people looking for jobs!
We expect manufacturing to rebound once the US Congress approves the USMCA, the revised version of NAFTA (North American Free Trade Agreement). Companies are increasingly moving their supply chains out of China as the trade negotiations drag on, and hopes for a quick resolution wane. If the USMCA is approved we foresee a quicker pace of manufacturing moving back to North America. While the jobs may not necessarily move back to the United States, having the supply chain closer to final consumption allows companies to react quickly to changes in demand. We expect growth in capital investment to resume as stability in trade policies is attained.
Moving manufacturing out of China to North America or other countries, while disruptive in the short-term, is beneficial in the long-term, especially when national security is taken into consideration. We expect the trade disruption to ameliorate once companies reorder their supply chains in response to the new geo-political realities.
CONCLUDING THOUGHTS
The flood of investor dollars to passive investing continues unabated. The top 3 shareholders of many companies are inevitably Vanguard, BlackRock and State Street Global – all passive investors. The shift to passive drives a disproportionate sum of investor money to a few, well-known, mega-capitalized, popular companies covered by numerous analysts. Conversely, a large number of smaller capitalization well-managed companies are ignored despite good growth prospects. As a result valuation becomes attractive and meets our investing criteria. We expect our opportunity set to increase as the passive craze rolls on.
On the surface the bond and equity markets are singing different tunes about the economy. However, a deeper dive under the hood illuminates more consonance. Our own bottom-up analysis, after reading hundreds of company reports, depicts a strong consumer willing and able to spend and keep the economy humming.
Thank you for your continued trust and confidence in Alamar Capital Management.
Sincerely,
George Tharakan, CFA
Disclosures
The views expressed in this note are as of the date initially published and are subject to change without notice. Alamar has no obligation or duty to update the information contained in this note. Past performance is not an indication of future results. Risk is inherent in investments and involves the possibility of loss.
This publication is made available for informational purposes only and should not be used for any other purpose. In particular, this report should not be construed as a solicitation of an offer to buy or sell any security. Information contained herein was obtained and derived from independent third-party sources. Alamar Capital Management, LLC believes the sources are reliable; however, it cannot guarantee the accuracy of such information and has not independently verified the accuracy or completeness of such information.
This publication, and the information contained herein, may not be copied, reproduced, republished, or posted in whole or in part, in any form or media without the prior written consent of Alamar Capital.
ACM Commentary 1Q 2019
MARKET COMMENTARY
The U.S. equity markets came roaring back in the first quarter of 2019, shaking off the 4th quarter hangover from last year, due to weakening global fundamentals and decreasing U.S. corporate earnings. In fact, the S&P finished the first quarter within a few percentage points from last September’s highs, as stocks flourished under a more accommodative Federal Reserve (Fed) and renewed optimism about the U.S. economy.
Not surprisingly, volatility fell considerably in the quarter as well. The CBOE Volatility Index (VIX), a measure of fear in the market, spiked dramatically towards the end of last year, only to dramatically reverse course and reflect relative calm by the end of this March. For their part, the broader markets have also reversed from a difficult 4th quarter in which investments of all stripes, save for low risk bonds, proved disappointing. Risk assets across the board have provided strong gains thus far in 2019, marking it the greatest start to a year since 1998. The chart below depicts the performance across various asset classes in the fourth quarter of 2018 vs the first quarter of 2019, reflecting the markets dramatic almost mirror like turnaround.
EXHIBIT 1: MARKET RETURNS 4Q 2018 vs 1Q 2019

*Ratio: 60% S&P 500 / 40% Barclays Aggregate Bonds
Despite the relative calm and outsized returns this year, the global economy has clearly slowed from 2018 into 2019. We suspect the three largest factors most associated with this slowdown are: tightening Fed policy, decreasing growth in China, Europe, and beyond, and continuing unresolved disputes on trade. All of which have weighed heavily on business, consumer, and investor sentiment. In fact, recognition of these near-term challenges was likely the chief culprit in dampening investor enthusiasm towards the end of 2018. Though much uncertainty remains, the market’s quick recovery in the first quarter of 2019 seems attributable to a somewhat coordinated change of heart on behalf of central banks in the U.S. and European Union (E.U.).
CENTRAL BANKS CHANGE OF HEART
At the end of 2018 it remained widely speculated that the Fed would follow what had been five sequential .25% rate hikes, and nine in total, with at least two more increases in 2019 and one in 2020. However, following meetings in late January the Fed decided to bring its monetary policy normalization to an end. Summarizing the meetings, Fed Chair Powell indicated that there was no longer an accommodative or tightening slant on behalf of the Fed. The interest rate hike cycle that began in December of 2015 and had seen rates increase from .25% to a still accommodative 2.5% had come to a halt. For its part, the European Central Bank (ECB) followed suit when in early March ECB president Mario Draghi announced the extension on the forecast for its first anticipated interest rate increase since July 2011 keeping rates near zero. The chart below depicts the policies pursued by the Fed and ECB dating back to the financial crisis. Interestingly, the ECB’s initial incorrect reaction to the crisis was to view it as purely a U.S. problem. As a result, the ECB was slower than the Fed to engage in dramatic reductions in their funds rate. Additionally, a stagnant economy has forced them to leave rates lower for longer than the Fed, having not increased rates in several years.
EXHIBIT 2: INTEREST RATES

It is now anticipated that the ECB will not move on rates for the remainder of 2019. Further, they have also recently announced an additional stimulus package to provide lower lending rates to banks in order to create better credit conditions for consumers and thereby stimulate growth. Not to be out done, after the FOMC meetings in March, the Fed further reduced expectations of rate hikes, and now project no rate hikes in 2019, a single increase in 2020 and none in 2021. This placed Fed policy much more in line with the broader bond markets which had been pricing in a higher likelihood that the Fed would cut rates than increase them. In fact, the decision by the Fed to increase rates in December of last year had been quite controversial as the bond market was already flashing warnings signs. Equally significant, following the meeting the Fed announced it would bring an end to its balance sheet Quantitative Tightening sooner than the market expected. The process will now be complete by this September. It is now anticipated the Fed balance sheet will hold roughly $3.7 trillion in bonds on a seemingly permanent basis. A figure 4 times higher than the $900 billion in bonds it held prior to the 2008 crisis! In addition to cutting rates to zero, the Fed responded to the financial crisis by purchasing massive amounts of bonds. They purchased both treasuries and, for the first time, mortgage backed securities. These measures were intended to encourage lending on behalf of banks, reduce borrowing costs for consumers, and revive economic growth. The bond buying, or “quantitative easing” that began at the height of the crisis clearly helped support financial markets. The second and third rounds, or QE2 an QE3 as they have been called, have proven more controversial. The chart below depicts the post crisis effort on behalf of the Fed and ECB to expand their balance sheets to stimulate growth. Again, the European Union (EU), which had exceeded the United States as the largest economy in the world in 2007, was slower to respond, albeit from a higher base. Further, the ECB elected to reduce assets in 2012, a period the US remained in expansion mode, only to reverse course with substantial purchases since 2015. With the recent announcement of a termination of quantitative tightening by the Fed, the U.S. more closely aligns its policy with that of the EU.
EXHIBIT 3: CENTRAL BANK BALANCE SHEETS

The US decision to hold off on rates and prematurely terminate quantitative tightening was driven by a slowing U.S. Economy. In early 2019 the Fed reduced growth expectations for 2019 to 2.1 percent from its 2.3 percent December of last year forecast. Their outlook for 2020 is an even lower 1.9 percent. Further reflecting a deteriorating economy, on March 28th 4th quarter 2018 US GDP was restated downward from 2.6% to 2.2%. This despite an environment when inflation and unemployment have remained quite low. Meanwhile, growth in Europe has been tepid for many years now. The following chart depicts quarterly Real GDP growth for both the US and EU and again dating back to the crisis.
EXHIBIT 4: U.S. & EUROPEAN UNION GROWTH

Given the massive monetary support that both the US and Europe have received it is interesting that their respective economies have not seen more significant recoveries. The US has grown much faster out of prior recessions while Europe has hardly grown at all. The US economy did manage to overcome Fed expectations in the 1st quarter of this year. On April 26th, it was announced that the economy grew at a rate of 3.2%, its best start in four years, and greater than the 2.5% anticipated. This has acted to help offset fears of slowing global growth in the near term and pleasantly surprised investors.
Nonetheless, now 10 years into the recovery with rates at still low levels and given bloated balance sheets there are fewer traditional levers available to Central Banks to manage the next inevitable crisis — both would argue they have additional tools at their disposal, but this would reflect policy that has never been done before.
As a result, we suspect fiscal policy (i.e. deficits) may play an even larger role to manage the next recession. The best evidence of this might be an unconventional economic theory floating around known as Modern Monetary Theory (MMT). MMT is not a mainstream idea just yet, but it is likely you will be hearing more about it in the weeks and months to come. At a conceptual level, the gist of MMT is that governments that issue their own fiat currency, such as the United States, have considerable freedom to manage larger debt burdens than previously realized, because of their ability to print money. The core of the idea is that a country that can issue its own currency carries no default risk, as they can always just print more dollars to pay their debts.
For example, a proponent of MMT might be inclined to hold up Japan as an example. Many have argued that Japan’s large fiscal deficits and considerable debt as a percentage of GDP would eventually lead to rising interest rates and inflation, but this has not been the case. Rates in Japan have hovered near zero for many years with little to no inflation. Of course, their economy has struggled to grow for many years as well.
Interestingly, the purported merits of MMT are not nearly as potentially attractive to the European Union and its members as the U.S. After all, the EU is a collection of many countries, all of whom gave up their own sovereign currency in 1999. As a result, countries like Greece for example are not in position to simply print more Euros to fend off creditors and pay their bills. As a result, MMT may provide a unique and additional contrast in how the U.S. and European Union might be inclined to manage the next crisis.
Further, given that it is election season here in the U.S., it is easy to see how MMT might be used to solicit votes. For example, Presidential Candidate Bernie Sanders, and recently elected democratic congresswoman Alexandria Ocasio-Cortez have used MMT to support Medicare for All, and the Green New Deal. However, in truth, for many years both sides of the aisle have shown a propensity to manage deficits in support of their agendas (Democrats use them to support entitlements and Republicans to support tax reform). As MMT gives them even more fuel, it will be interesting to see if this concept continues to gain more steam.
SUMMARY
Fortunately, though there is an undeniable correlation between the economy and the stock market, it is not an overly strong one. After all, the US stock market has performed quite well for over a decade despite fledgling growth. It also might come as a surprise to many that the stock market does just fine through recessions. The S&P 500 has averaged a 6.7% return in recessions since 1900. The far larger threat to the market, as we experienced late last year, is a sharp change in sentiment, or an unforeseen policy shift. It is also important to point out that over the long haul the real arbiter of value is growth in corporate profits. Along those lines, in our proprietary equity strategy we remain able to identify and invest in solid individual companies with good prospects. Additionally, in our Alamar Wealth strategy we continue to invest for the long term.
Thank you for your trust and continued consideration,
John Murphy, CFA
DISCLOSURES
The views expressed in this note are as of the date initially published and are subject to change without notice. Alamar has no obligation or duty to update the information contained in this note. Past performance is not an indication of future results. Risk is inherent in investments and involves the possibility of loss. Net of fee performance is calculated using the highest fee. The Russell 3000 Index measures the performance of the largest 3000 U.S. companies representing approximately 98% of the investable U.S. equity market. The S&P 500 Index, which is a market-capitalization weighted index containing the 500 most widely held companies chosen with respect to market size, liquidity, and industry.
This publication is made available for informational purposes only and should not be used for any other purpose. This report should not be construed as a solicitation of an offer to buy or sell any security. Information contained herein was obtained and derived from independent third-party sources. Alamar Capital Management, LLC believes the sources are reliable; however, it cannot guarantee the accuracy of such information and has not independently verified the accuracy or completeness of such information.
This publication, and the information contained herein, may not be copied, reproduced, republished, or posted in whole or in part, in any form or media without the prior written consent of Alamar Capital.
ACM Commentary 3Q 2018
With sustained good earnings fundamentals, the market continued to digest a multitude of fears and marched higher in the 3rd quarter. The S&P achieved a 7.7% return in the quarter and was up over 10.6% on the year. However, as you undoubtedly have realized, things changed dramatically in October, a month famous for Halloween and, even scarier, market corrections.
With significant volatility the S&P was down -6.8% in October, erasing much of the year’s prior gains. The chart below depicts the impact the past month has had on broader US equity markets returns.
Figure 1: US Equity Market Returns – Through October

Truth be told, returns were considerably lower in earlier periods during the month, and subject to dramatic inter and intraday swings. The pullback felt more painful than the figures above indicate, as the markets benefited from big gains in the last two trading days of the month. Both the S&P and NASDAQ entered correction territory, defined as losses greater than -10% during the month. The drawdown was broadly based, as 9 of the 11 economic sectors in the S&P were down, lead lower by growth components energy (-11.3%), consumer discretionary (-11.3%) and industrials (-10.9%). Defensive sectors consumer staples (+2.1%), and utilities (+1.9%) proved to be the only places to hide.
For their part, heavily out of favor international stocks fared even worse, providing little respite for investors in search of diversification. The international developed market EAFE index was down -10% on the month and is now down -13% on the year. Emerging markets proved even more volatile and were down -11% and -20% over the same period.
Though the temptation to identify and predict volatile swings in the market is strong, the effectiveness of such an effort is probably overstated. Market sentiment is impossible to predict in the short-term, and its root cause can be difficult to determine. It is uncanny the extent to which investors can overlook near term risk for a stretch of time, only to be overwhelmed by it in others. At Alamar we are familiar with this phenomenon as it applies to our equity portfolio. Oftentimes, positions we foresee owning for several years can see their prices fall dramatically based on a single quarter’s performance. These swings present us the opportunity to add to our position in a company, and we are happy to purchase stock from investors that do not carry our same conviction. In exchange for this, we must adjust to the reality that the ride towards solid long-term investment results is not always a smooth one.
As painful as a market correction can feel for investors, it is useful to remember that historically short-term volatility is much more the rule than the exception. The chart below helps to put the market’s recent decline into perspective. It shows the average drawdown in the S&P, the frequency, and typical time for
the market to recover since 1980. Notably, over the period the S&P 500 index experienced an average intra-year decline of nearly 14%! Yet despite this, it has managed to produce a positive return in 29 of the past 38 calendar years, or 72% of the time. This brings credence to the notion that most of the time investors are much better served to buy dips than sell them.
Figure 2: S&P 500 Frequency of Pullbacks (1980 – Present)

The recent bull market run is one of the longest and largest in modern history. Whether October’s move turns out as a hiccup, prior to new highs, or a precursor towards recession should have little concern for the long-term properly positioned investor.
At Alamar, we prefer to focus on the underlying fundamentals of individual companies and not investor sentiment. In our minds, the single most important driver of stock market performance is corporate profits, specifically earnings per share (EPS). In our equity portfolio we strive to identify well run companies that are projected to achieve solid and predictable earnings growth and with reasonable valuations. At the same time, we avoid exposure to momentum and fad stocks. We have discussed in the past the extent to which much of the recent market’s gains can be attributed to just a few companies. We have coined these companies FAMAA (Facebook, Amazon, Microsoft, Apple, Alphabet) and have never owned them as we have struggled with their tremendous size, valuation risk and/or narrow product lines.
Figure 3: FAMAA stocks starting to lose steam?

To put their impact into perspective, since the market’s 2009 bottom through the end of the most recent quarter, the market capitalization of companies listed in the S&P 500 has grown by over $18 trillion. The 5 FAMAA stocks alone have seen their market capitalizations grow by almost $4 trillion, making them responsible for 22% of the S&P’s total gain!
It is our view that periods that witness only a few names driving stock market performance may not be ideal for the markets over the long run. First, there were the Nifty Fifty stocks in the early 1970’s, and more recently the late 1990’s when most of the S&P 500’s movements were driven by just 4 names – Microsoft (again), Intel, Cisco, and Dell. In both instances, the outcome was eventually unfavorable for investors, and as the saying goes history may not repeat, but it rhymes.
For our part, we continue to focus on our portfolio of stocks ability to continue to achieve meaningful earnings growth. We recognize that the economy is slowing from peak levels. Fortunately, for us our internal requirements for attractive growth in a business is considerably less than that being achieved by the market in recent months. On the valuation front, the S&P currently trades at 15.5x times forward earnings. This does not strike us as overly expensive and is considerably less than 2000 and 2008.
CONCLUSION
Whether the recent correction in the market is short-term, or a more meaningful correction remains to be seen. In either event, and over the course of time, the cyclical nature of the economy can prove to be advantageous for patient long term equity investors. Further, even in times of difficulty opportunity can be found in the markets.
Thank you for your time and consideration –
John Murphy, CFA
DISCLOSURES
The views expressed in this note are as of the date initially published and are subject to change without notice. Alamar has no obligation or duty to update the information contained in this note. Past performance is not an indication of future results. Risk is inherent in investments and involves the possibility of loss. Net of fee performance is calculated using the highest fee. The Russell 3000 Index measures the performance of the largest 3000 U.S. companies representing approximately 98% of the investable U.S. equity market. The S&P 500 Index, which is a market-capitalization weighted index containing the 500 most widely held companies chosen with respect to market size, liquidity, and industry.
This publication is made available for informational purposes only and should not be used for any other purpose. This report should not be construed as a solicitation of an offer to buy or sell any security. Information contained herein was obtained and derived from independent third-party sources. Alamar Capital Management, LLC believes the sources are reliable; however, it cannot guarantee the accuracy of such information and has not independently verified the accuracy or completeness of such information.
This publication, and the information contained herein, may not be copied, reproduced, republished, or posted in whole or in part, in any form or media without the prior written consent of Alamar Capital.
ACM Commentary 2Q 2018
Despite good earnings fundamentals, the S&P500 is up only 2.6% through the end of the 1st half, probably due to fears of rising rates and possible trade wars. As in prior years, most of the gains have come from the FAMAA (Facebook, Amazon, Microsoft, Apple and Alphabet) stocks. Without these Fab5 the S&P500 would be barely up for the year. Despite never investing in FAMAA stocks our investments have performed well. In fact 16 of the 42 stocks we own, roughly 40% of the portfolio, have more than doubled since we first purchased them. Some of these have tripled or quadrupled and the best performer is now a 16-bagger. None of these investments experienced a smooth ride after we invested in them. Over the years there were numerous large share price declines due to earnings misses and lowered growth expectations. These stocks are not isolated to a particular sector but spread across the consumer, financial, healthcare, energy and technology sectors. We hope the remaining 26 stocks catch up with their brethren over time.
From our vantage point the largest impediments to the market moving forward are: rising interest rates, narrowing spreads and trade wars. In this note, due to space constraints, we will address the issues dealing with interest rates. We postpone trade tensions to another discussion except to note that if there was ever a time to correct trade imbalances through penalties, it is at the present moment whilst the US economy is on an impressive upturn.
WHAT DO NARROWING SPREADS PORTEND?
Investors are presently very focused on the term-structure of interest rates. The term-structure defines the interest rate demanded by the market at various maturities. Typically, US Treasury yields are used as a representation of the term-structure. Yields at various maturity dates – 3 months, 1 year, 2, 5, 10 & 30 years are plotted on a curve. Most of the time the yield curve slopes upwards – 10 year yields are higher than 5 year bonds and 5 is larger than 2 year maturities and so on. An upward sloping curve signifies a growing economy and/or higher inflationary expectations in the future. Conversely, an inverted yield curve, where long-term rates are lower than short-term rates, portends trouble down the road. Since the Federal Reserve has a significant influence on the very short-end of the curve through the Federal Funds rate, investors focus on the intermediate to the longer end of the curve which is primarily set by market participants. In particular, investors focus on the 2-year and longer maturity yields.
Figure 1 plots the Treasury yield curve at the end of the second quarter. Notice that the curve is sloping upwards from the 1 month maturity to about 3 years. After 3 years the curve begins to flatten considerably such that the yield at a 30 year maturity (2.98%) is not much more than the yield at a 3 year maturity (2.63%). Such a flattening of the curve is a problem for institutions that invest in long-maturity securities such as insurance companies and pension plans. Investors are not being paid to invest in longer maturity securities.
Figure 1: Treasury yield curve on June 29, 2018
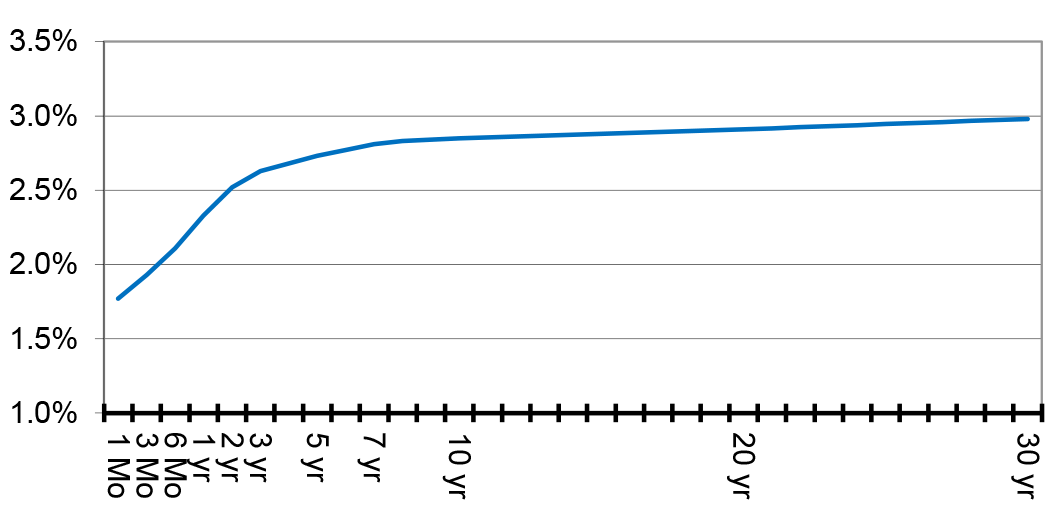
Source: US Treasury
The primary concern from an equity investor’s viewpoint: does the flattening curve signify problems down the road? Historically, one of the best indicators of an oncoming recession is an inverted yield curve. However, this indicator is not a perfect predictor and certainly the timing is frequently off. To understand why this is the case we have plotted the difference or spread between the 10-year and 2-year yields over the last 50 years in Figure 2.
As you can see, the line dips below 0% (the curve is inverted) when the economy is typically in a recession as was the case in 1973, 1980, 1990 and 2001. However, the timing is never optimal. For example, the curve began to drop in 1997, a full 4 years before the actual recession in 2001. If investors had sold equities and gone to cash in 1997, in response to the declining spreads, they would have missed out on very large gains over the next 3 years. Similarly the curve briefly dropped into negative territory in 2006 well before the recession in 2008. Indeed by 2008 the curve was already deep into positive territory reflecting a steep yield curve. Getting fully invested in 2008 would have considerably lightened investor pockets! The 2-10 year spread currently (0.31%) is similar to the environment in 1997 and 2005. As you may recall, both of those prior periods provided wonderful investing backdrops. Looking at the numerous indicators we track, we do not currently foresee a recession on the near horizon.
Figure 2: 2-year/10-year Treasury yield spreads

Source: US Treasury
IS RISING RATES A HEADWIND FOR THE MARKETS?
Besides narrowing spreads, another issue that concerns investors presently is the rise in interest rates. Note that the rise in rates has been concentrated in the front-end of the maturity curve. The 2-year interest rate for example has gone from less than 0.50% in 2011 to over 2.5% now. However, the long-term rates, such as the 10-year maturity, have barely budged. In 2011 the 10-year rate averaged 2.78%, not much different from the 2.8% now.
Since equity is the ultimate long-term investment (there is no maturity for a stock), investors typically discount cash-flows using the 10-year treasury as a benchmark and adding an equity risk premium. Indeed a regression of the price-to-earnings (P/E) multiple of the market to the 10-year Treasury rate shows a meaningful correlation. We ran regressions of both the trailing P/E (price to trailing earnings) and forward P/E (price to forecast earnings) and the results were much stronger for the trailing P/E regression.
Figure 3 plots the regression of the trailing P/E of the S&P500 to the 10-year treasury yield. The graph plots P/E to yields since 1960 covering inflationary periods, disinflationary times, recessions and expansions. While there are many variables that go into calculating the value of the stock market, the 10-year rate explains roughly 1/3 of the variation. Care must be taken to not put too much emphasis on a single factor as the figure clearly shows that P/E multiples deviate significantly from values predicted by the regression model. Nevertheless, the model does follow what economics teaches us – high interest rates are a headwind for the markets as shown by the negative sign for the interest rate coefficient. Indeed the model provides a simple estimation of the trailing P/E for any given interest rate. For instance, if the 10-year rate is at 4%, the model predicts the trailing P/E should be 22.6 – 4% = 18.6. Given the current 10-year rate at 2.82% the model predicts a trailing P/E of 19.8. If we use 2017 earnings as the trailing number we get a price for the S&P500 of 2,465. If we use 2018 earnings instead, we get 3,125. As of this writing the S&P500 happens to be roughly at the midpoint of the two targets!
Figure 3: Trailing P/E to 10 year Treasury yield

Source: S & P, Alamar calculations
Notice the predicted P/E above is very different from the Shiller CAPE (cyclically adjusted P/E). The Shiller CAPE does not use the 10-year rate or any interest rate for that matter. It simply averages the prior 10 years of inflation-adjusted earnings to make an estimate. On that basis the market is much overvalued currently as the CAPE shows a P/E of 32.
CONCLUDING THOUGHTS
Investors are rightfully focused on the narrowing interest rate spreads as a harbinger of oncoming recession. While we remain vigilant of this signal, we do not presently see any signs of economic slowdown. Historically, markets have continued to power forward for many years after the first signs of a narrowing spread. Investors getting out of the stock market at the first sign of tightening spreads would have missed out on large gains.
Another investor concern is rising interest rates, especially at the short-end. Our analysis shows that with present 10-year rates and levels of corporate profits, the S&P500 is reasonably valued. Higher rates could pose a headwind going forward.
We continue to find solid opportunities that meet our investment criteria – well managed companies with good growth trading at reasonable valuations. Forty percent of our investments have already done spectacularly well since we invested in them and we hope the others will follow.
Thank you for your continued trust and confidence in Alamar Capital Management.
Sincerely,
George Tharakan, CFA
george@alamarcapital.com
Disclosures
The views expressed in this note are as of the date initially published and are subject to change without notice. Alamar has no obligation or duty to update the information contained in this note. Past performance is not an indication of future results. Risk is inherent in investments and involves the possibility of loss.
This publication is made available for informational purposes only and should not be used for any other purpose. In particular, this report should not be construed as a solicitation of an offer to buy or sell any security. Information contained herein was obtained and derived from independent third-party sources. Alamar Capital Management, LLC believes the sources are reliable; however, it cannot guarantee the accuracy of such information and has not independently verified the accuracy or completeness of such information.
This publication, and the information contained herein, may not be copied, reproduced, republished, or posted in whole or in part, in any form or media without the prior written consent of Alamar Capital.
ACM Commentary 1Q 2018
SUMMARY
In our past writings have we discussed the critical benefit of a long-term investment time horizon for investors. We pointed out that though stock market volatility can be considerable in any given year, it is smoothed out with the passage of time. As a result, investors with long term time horizons and/or higher risk tolerance levels maintain a significant competitive advantage when it comes to investing. However, of course, many investors struggle with short term volatility. Because of this, we thought we would touch on another tool that can be helpful to investors this quarter – Diversification. Additionally, because diversification plays a critical role in determining whether we as investors ultimately achieve our goals, we will share a useful tool known as a benchmark which can be used to help monitor its relative effectiveness.
DIVERSIFICATION
Diversification involves the combination of risky assets such as stocks with less risky and uncorrelated assets such as bonds to reduce the overall risk in a portfolio. The use of diversification can be very helpful for investors with shorter investment time horizons, or an interest in reducing risk in their portfolios.
The chart below compares the performance of an investment 100% in stocks against a portfolio that has 60% exposure to Stocks and 40% exposure to bonds, or a 60/40 portfolio in investment vernacular. For the stock allocation we selected the S&P 500 and for bonds we have used 10 Year US Treasury Bonds. The performance is shown on a rolling 3-year basis meaning the first calculation is for the 3-year annualized return from 1928 to 1930, the next is from 1929 to 1931, and so on all the way through the close of last year, when the return from 2015 through 2017 is calculated. In total, returns are calculated over 88 different time periods. We used a 3-year time-period for the chart because in our minds it is the minimum amount of time necessary to consider a meaningful investment in risk assets.

As you can see, on average a portfolio 100% allocated to stocks does better over the period. The average return for the S&P was 10.0% compared to 8.4% for the 60/40 blend. One Dollar invested in the S&P 500 in 1928 would have grown to almost $4,000 by end of 2017, compared to just shy of $1,300 for a 60/40 investment. However, the performance of the 60/40 portfolio, not surprisingly, really stands out during down markets. For instance, the blended index managed a small .6% annualized 3-year gain for the period ending in 2008, while the S&P was down -8.2% annualized. Additionally, the odds of a positive return on a rolling 3-year basis were also higher for 60/40 investors than an investor in the S&P. A 60/40 investor had a 90% chance of a positive return, compared to 83% for the S&P
One could say that a diversified investor gives up some of the upside in their portfolio in exchange for a bit more certainty. The question of how much insurance, or exposure to less risky assets is needed, is answered differently by each of us. We chose a 60/40 blend in our example because it is one of the more popular allocations. The challenge is to determine the appropriate risk exposure to enable us to achieve our goals without exceeding our own individual comfort levels. For many, this level is typically found when they can achieve peace of mind knowing that their future spending needs will be met, while preserving the ability to stay the course with their investments during times of heightened volatility.
The chart below shows a spectrum of exposure to risk over the past 10 years ranging from T-Bills (Cash) to 100% equities. Like before the blended index includes the percentage exposure to stocks and bonds.

*Blended strategies include % exposure to S&P 500 / % Exposure to Barclays Aggregate
As you can see, there has been a direct correlation between the level of risk taken and the return secured over the past decade. An investor in T-Bills has not been able to keep pace with inflation and has seen little return on their investment. Meanwhile, an investor with 60% exposure to the S&P and 40% exposure to bonds has seen their investment increase by 9.6% in each of the past 7 years. Of course, in periods of prolonged market gains it is easy for more conservatively positioned investors to start to second guess their exposure to risk. However, rather than thinking of investing as a choice between cash and stocks, or risk off risk on, we believe investors are much better served to focus on making sure that they are maximizing their return for the level of risk being taken in their portfolios. The best way to do this is by using another handy tool known as a Benchmark.
WHAT IS YOUR BENCHMARK
A benchmark is defined as a standard or measure that is used to compare the allocation and return of a given portfolio. It allows us to measure the performance of our investments on a risk adjusted basis by incorporating the percentage exposure of our portfolio to risky and less risky asset classes.
There are of course many more investment asset classes than the S&P 500 and Aggregate bonds that investors may choose from in constructing portfolios. Some would argue that a Benchmark needs to include the percentage exposure to all the asset classes that a portfolio is exposed to. As a result, they create what can become very complicated blended benchmarks that already reflect all the investment allocation decisions that have been made in a portfolio. However, once an asset class has been placed in a benchmark, say international equities, or emerging markets for example, the relative merit of the decision to add international stocks in the portfolio can no longer be determined (both have been detrimental in recent years).
Instead, by creating a simple straightforward two strategy benchmark, as we have done above, we can measure the impact and timing of our additional diversification decisions, or more importantly those being made on our behalf. This approach can be particularly powerful in instances where we, or our advisors are exclusively using passive index funds. In this case the allocation decision, or which asset classes to own and when, is the only ACTIVE decision being made. Why not measure its relative effectiveness?
If you are a client of ours, we spell out your appropriate benchmark and our performance against it clearly on our quarterly statement. If you or your advisor do not calculate it, you can determine it for yourself by adding the percentage exposure to equities as well as your exposure to bonds and cash from your most recent brokerage statement. With this ratio in hand you can now compare your performance against the corresponding blend in the chart above. So, how are your results?
Please feel free to reach out to us anytime if we can be of assistance. We are always happy to meet to discuss our investment approach and/or provide a free assessment on assets outside of our control.
Thank you for your time and consideration –
Best regards,
John Murphy, CFA
DISCLOSURES
The views expressed in this note are as of the date initially published and are subject to change without notice. Alamar has no obligation or duty to update the information contained in this note. Past performance is not an indication of future results. Risk is inherent in investments and involves the possibility of loss. Net of fee performance is calculated using the highest fee. The Russell 3000 Index measures the performance of the largest 3000 U.S. companies representing approximately 98% of the investable U.S. equity market. The S&P 500 Index, which is a market-capitalization weighted index containing the 500 most widely held companies chosen with respect to market size, liquidity, and industry.
This publication is made available for informational purposes only and should not be used for any other purpose. This report should not be construed as a solicitation of an offer to buy or sell any security. Information contained herein was obtained and derived from independent third-party sources. Alamar Capital Management, LLC believes the sources are reliable; however, it cannot guarantee the accuracy of such information and has not independently verified the accuracy or completeness of such information.
This publication, and the information contained herein, may not be copied, reproduced, republished, or posted in whole or in part, in any form or media without the prior written consent of Alamar Capital.
ACM Commentary 4Q 2017
The rally since the November 2016 elections has continued more or less unabated, until recently. The passage of tax reform has added more fuel to the stock market fire. The S&P500 was up 21.8% in 2017 while Alamar Equity gained 21.4%. Since inception in 2010, the S&P500 is up 13.9% annualized and Alamar is up 14.1%. In hindsight, our timing was fortuitous; however, we did not expect such rapid gains so quickly out of the chutes.
There are justifiable concerns amongst many market participants that we have come too far too fast. In this note we will look at the most important driver of returns, corporate profits, to determine if present market levels are justified. We will also explore if corporate animal spirits have been unleashed with the new regulatory regime.
FEDERAL REGULATIONS
One of the drivers missing from this recovery has been capital spending or investments by corporations. Typically, capital spending has increased by roughly 6-7% annually in past recoveries. This time, however, the increase has been much lower – in the order of 4% since the recovery began in 2010. Figure 1 plots the growth in capital spending over the last 30 years. Notice the anemic recovery since 2010.
Figure 1: Growth in US Capital Spending

Source: BEA
The data spurs the question – why? Why haven’t the animal spirits been unleashed this time? Two potential reasons, repeatedly mentioned by corporate management teams, are relatively high corporate taxes in the US compared to other OECD countries and overly restrictive regulations encumbering new projects. We will revisit taxation in a future missive but for now focus on regulatory barriers.
President Trump came into office vowing to reduce Federal regulations that, in his mind, have hampered investment. He has appointed a number of administrators charged with streamlining the regulatory hurdles including the Environmental Protection Agency (EPA), Food & Drug Administration (FDA) and the Federal Communications Commission (FCC). One, albeit crude, measure of the total number of regulations, is to count the number of pages in the Federal Register where all rules must be published. Figure 2 plots the total number of pages for final rules since 2000.
Figure 2: Growth in US Regulations

Source: CEI
Notice the large jump in the final year of President Obama’s term when pages jumped up by 56%! While the final tally for 2017 is still being assembled, early indications portray the new administration has reduced the page count by over 20%. It remains to be seen if the two-pronged thrust of lower taxes and a lighter regulatory touch will finally spur investment, but the early indicators and annual forecasts from corporate executives on year-end conference calls look very promising.
CORPORATE PROFITS
The single most important driver of stock market returns is corporate profits, specifically earnings per share (EPS). EPS growth trumps Fed easing/tightening, change in administrations and numerous other news headlines that capture attention such as North Korea or the latest tweet from the President.
Figure 3 plots the EPS of the S&P 500 index over the last 30 years. I have also fitted a trend-line that best fits the curve. Over the years EPS has grown roughly 6.5% annually, in line with nominal growth in US GDP. Of course, as shown in the graph, it is not a smooth curve up and to the right; there are peaks and valleys in accordance with the booms and busts of the economy. We live in a cyclical world, but the long-term trend is clear. The EPS numbers are tabulated from the bottom up. The profits of all 500 companies in the index are summed to calculate the final number. Note that the 2017 EPS number ($124.2) is still being finalized as companies report their 4th quarter results. Similarly the 2018 EPS ($152) is also subject to change as companies provide their forecasts.
Figure 3: S&P 500 Operating EPS

Notice in the above figure that we are only now, 8 years after the start of the recovery, crossing the long-term trend line in a meaningful manner! We suspect the final EPS for 2018 will be higher than currently expected as the full thrust of lower taxes and higher capital spending get into high gear.
IS THE MARKET OVERVALUED?
Now that we have an estimate of 2018 earnings we can look at price-to-earnings (P/E) multiples to understand if the market is over or under valued. Figure 4 plots forward P/E multiples for the S&P500 since 1985. As you can see, multiples are not very extended compared to historical ranges. The current multiple of 17.5x 2018 EPS is well within normal and nowhere close to the peak multiples in 2000 and 2007. We are happy to purchase stocks at 17.5 multiples for 8-10% earnings growth.
Figure 4: S&P 500 Forward P/E

CONCLUDING THOUGHTS
Economic growth, and therefore corporate profits, could very well pick up after a long period of torpor due to lower taxes, regulations and higher capital spending. The stock market at these levels, we feel, is reasonably priced if current earnings projections come to fruition. We continue to find solid opportunities that meet our investment criteria – well managed companies with good growth trading at reasonable valuations.
Thank you for your continued trust and confidence in Alamar Capital Management.
Sincerely,
George Tharakan, CFA
george@alamarcapital.com
Disclosures
The views expressed in this note are as of the date initially published and are subject to change without notice. Alamar has no obligation or duty to update the information contained in this note. Past performance is not an indication of future results. Risk is inherent in investments and involves the possibility of loss.
This publication is made available for informational purposes only and should not be used for any other purpose. In particular, this report should not be construed as a solicitation of an offer to buy or sell any security. Information contained herein was obtained and derived from independent third-party sources. Alamar Capital Management, LLC believes the sources are reliable; however, it cannot guarantee the accuracy of such information and has not independently verified the accuracy or completeness of such information.
This publication, and the information contained herein, may not be copied, reproduced, republished, or posted in whole or in part, in any form or media without the prior written consent of Alamar Capital.
ACM Commentary 3Q 2017
The S&P 500 was up 4.5% in the 3rd quarter, its 8th quarter in a row of gains. The index was up 14% through the third quarter, and has not posted a negative annual return since 2008. In that time, it has now provided a cumulative return including dividends of almost 200%! This move has equity investors feeling complacent, while others more conservatively positioned are growing anxious about how to best position themselves moving forward.

Given this, we thought it might be useful to provide some historical context on the S&P, and to discuss the considerable benefits of a long-term investment time horizon with this quarter’s writing. Despite the market’s recent run, we believe that there is still plenty of room for optimism in the years ahead.
WHY WE INVEST
When markets make dramatic moves up or down it is important for us to remember as investors why we are investing in the markets to begin with – namely to preserve and to grow the purchasing power of our money over time. The short-term volatility in the market oftentimes distracts us from this goal because investors focus on the risk of losing money in the market, while at the same time neglecting to acknowledge the risk associated with not participating at all.
For instance, on the following page we show the performance of the hypothetical growth of one dollar in three different investment choices the S&P, 10 Year US Bonds, and Treasury Bills from 1928 through 2016. The difference in the performance of these three investments over the period is quite dramatic.

As you can see, it is not much of a contest with the S&P’s return trouncing government bonds and T-bills. Also, it is worth considering that inflation averaged 3% for the period. Due to this, investments had to return over 3% annually to maintain a constant standard of living. Put more simply, it requires $13.95 to purchase the same amount of goods today that just $1 purchased in 1928. A safe investment in US 10 Year bonds grew to $72, and even safer Treasury Bills reached just $20. They were both able to overcome inflation’s hurdle, but not by much. Meanwhile, that same investment in the S&P resulted in $3,286!
WHAT IS YOUR TIME HORIZON?
No doubt, an investment in the equity markets carries with it risk, particularly in the short run. The chart below shows the yearly performance of the S&P over the same period 1928 to 2016. The results show many peaks and valleys with high highs and low lows surrounding an average return, creating considerable challenges to be overcome by investors. Though the average return over the period remains attractive, it’s the downside volatility of the returns in the short run that tempted investors to make mistakes.

For instance, an investor placing a one-year bet on the market had a reasonable 73% chance of a positive return in any given year (the market was positive in 65 of 89 years). However, negating this benefit was the possibility of loss, which averaged -14% for the period, and surely exceeding the pain threshold for some investors.
The last few years notwithstanding, the market has been and will continue to be susceptible to swings, which result in investors being pleasantly surprised in some years and disappointed in others. Due to the market’s unpredictable nature, equity investors are encouraged to take a long-term view, which carries with it considerable advantages. First, the probability of a positive return increases with time, while downside risk is reduced. Additionally, due to the power of compounding, the more time that money is invested, the more time it has to grow. As a result, an investor with a longer horizon takes less risk than an investor looking only a year or two into the future, and has a higher likelihood of achieving a favorable return. We can show this by approaching the same 1928 to 2016 window, but framed differently over 10-year rolling periods. This is done by calculating the annualized return for each 10-year period from 1937 to 2016. In other words, the first return in the series is determined by calculating the 10- year annualized return from 1928 through 1937, the next from 1929 through 1938, and so on. The results of this subtle adjustment are good news for equity investors.

Viewing the exact same data through a longer lens mitigates the risk that is apparent in the shorter periods. For instance, an investor on a rolling 10-year investment horizon had an improved 94% probability of a positive return (the market was positive in 75 of the 80 periods the calculation was measured). Further, the average negative return was reduced to just -1%, from the previous -14%. The only negative returns being achieved in 3 consecutive periods near the end of the depression, and more recently in the 10-year periods ending in the ’07 and ’08 great recession. Fortunately, this smoothing out of volatility continually improves the further time is stretched. Taken to an extreme for instance, viewing the data over 40 years reveals something of a Goldilocks environment, with many years of returns consistent with the average return, and the lowest return in any one period being an acceptable 8.5%.
(If you are interested in viewing a spreadsheet which depicts the rolling returns on the S&P over various time periods click on this link.)
CONCLUSION
Of course, the world is uncertain and there is no guarantee that the future will emulate the past. However, history has shown the need to embrace risk to meaningfully offset the impact of inflation and preserve purchasing power.
As of this writing, the market continues to flirt with all-time highs, causing complacency among those who are in the equity markets, as well as consternation and regret for those heavy in cash. It is useful to remember that it is very difficult to time a market correction and that even if successful they prove difficult to profit from. Additionally, electing to wait out the market in cash or Treasuries, carries an expense of its own. With this writing we have simply suggested the merits of taking a longer view. To prove this point we looked at a long period of time that distinctly shows the advantages that the equity markets have over more conservative alternatives. Next, we pointed out the risk in equity markets over the short term and reduced this risk by viewing the same data over longer rolling periods. Of course, there are other more active tools available to help mitigate risk, which we will discuss in future writings.
At Alamar we believe that the equity markets continue to provide the best opportunity to improve investors standard of living over time. For us, whether to take on risk or not is less the question than taking an amount of risk that is appropriate and suitable, given each of our specific circumstances and individual investment horizons.
Thank you for your continued interest and consideration.
DISCLOSURES
The views expressed in this note are as of the date initially published and are subject to change without notice. Alamar has no obligation or duty to update the information contained in this note. Past performance is not an indication of future results. Risk is inherent in investments and involves the possibility of loss. Net of fee performance is calculated using the highest fee. The Russell 3000 Index measures the performance of the largest 3000 U.S. companies representing approximately 98% of the investable U.S. equity market. The S&P 500 Index, which is a market-capitalization weighted index containing the 500 most widely held companies chosen with respect to market size, liquidity, and industry.
This publication is made available for informational purposes only and should not be used for any other purpose. This report should not be construed as a solicitation of an offer to buy or sell any security. Information contained herein was obtained and derived from independent third-party sources. Alamar Capital Management, LLC believes the sources are reliable; however, it cannot guarantee the accuracy of such information and has not independently verified the accuracy or completeness of such information.
This publication, and the information contained herein, may not be copied, reproduced, republished, or posted in whole or in part, in any form or media without the prior written consent of Alamar Capital.
ACM Commentary 2Q 2017
The first six months of this year have led to repeated new highs for the US stock market and in many other parts of the world. The S&P500 is up roughly 9.3% through the end of June, primarily led by a few well-known names with large weightings in the index.
After almost a decade, the Federal Reserve has finally announced its intention to reduce its balance sheet. This is a momentous decision and needs to be carefully orchestrated to minimize disruptions to the ongoing economic recovery. In the rest of this note, we will discuss the Fed balance sheet and the impact a few names have had on market returns.
FAMAA REVISITED
We first talked about the impact of a few stocks propelling overall market returns in our Q4 2015 writing. Back then we termed these the FAMA stocks, comprising Facebook, Amazon, Microsoft & Alphabet (formerly Google). In this note, we add an additional member, Apple, to this quartet, so now FAMA morphs into FAMAA. These 5 companies now represent almost $3 Trillion in market value or over 12.5% of the S&P500.
To understand the impact of these 5 companies in an index of 500 companies, we need to look at their relative contribution to index returns. In the first half of 2017, FAMAA has contributed roughly 29% of total S&P500 returns. In other words, without these 5 companies, the S&P500 would be up 7.5% instead of 9.3%. A similar pattern holds over longer periods of time. For instance, since the start of 2013, FAMAA represented 31% of total S&P500 returns. The S&P500 is up roughly 15% annualized during this period. Without FAMAA, the index would be up 12.4% annualized.
Such narrow concentration of companies powering overall index returns is a cause for concern. Too many individual and institutional investors have piled into these select few names, pushing prices up further. Passive funds such as ETFs have only exacerbated this phenomenon. As discussed above, FAMAA now represents 12.5% of the S&P500 index and is an even larger 40% of the NASDAQ 100. As investors pour money into passive funds which simply mimic popular indices, the incremental buying concentrates purchases into these select names. Buying begets more buying. Historically when the market was dominated by a select few companies, it typically ended in tears. Determining the precise timing of when the mania ends is, of course, an exercise in futility.
At Alamar, we have stayed away from joining the crowds. We have not, and presently do not, own any of the FAMAA names, albeit to our detriment since these stocks have performed exceptionally well. Despite not being involved in these stocks we have generated good performance, particularly on a risk-adjusted basis. The question before us now is will these stocks continue to power returns as the Fed begins to withdraw the liquidity it has provided over the last decade.
THE FED UNWIND
The Federal Reserve, in response to the financial crisis of 2007 and 2008, proceeded to purchase a large amount of securities to stabilize the economy. As depicted in Figure 1, the Fed’s balance sheet exploded from just under $1 Trillion to over $4.5 Trillion in 7 years through four rounds of quantitative easing (QE). Treasuries and Mortgage Backed Securities (MBS) issued by FannieMae & FreddieMac were purchased during this expansion. To lower long-term interest rates the Fed proceeded to purchase securities with extended maturities.
Figure 1: Fed Balance Sheet
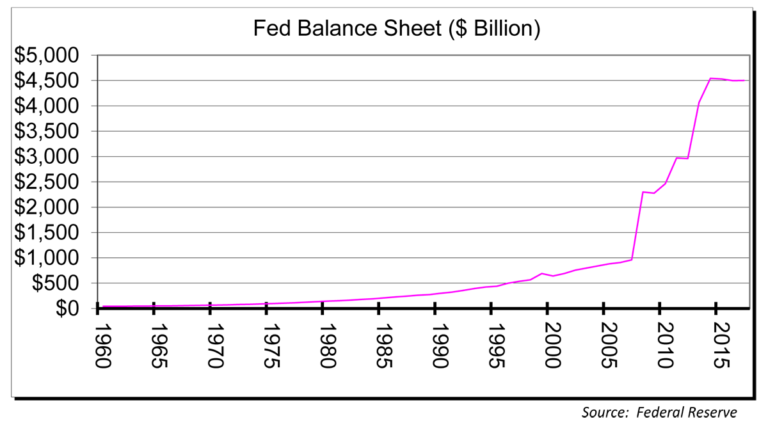
The Fed was successful in its efforts to lower both short-term and long-term interest rates but it came at the expense of a large involvement by the central bank in the workings of the economy. Figure 2 shows the size of the balance sheet as a percentage of GDP. Historically, the Fed balance sheet has fluctuated between 5% and 7% of GDP. Through repeated market interventions, the Fed had increased its balance sheet to 26% of GDP by 2014.
Figure 2: Fed Balance Sheet as % of GDP

During the 7 years of Fed intervention (2008 – 2014), there has been a widespread concern, shared by us, that this additional liquidity would cause inflation to spike up dramatically. One of the primary lessons of economics is that inflation is caused by more money chasing a fixed amount of goods. No less than Nobel-laureate Milton Friedman had espoused that, “inflation is always and everywhere a monetary phenomenon”. However, to our surprise, the Fed intervention did not result in general inflation. Overall prices of goods and services have not increased more than historic norms. The primary reason for this was the collapse in money velocity. Figure 3 plots the velocity of money since 1960. M2 velocity was close to 2.0 at the end of 2007 and has now dropped 30% to a low of 1.4. The money pumped by the Federal Reserve typically percolates into the economy through banks in the form of loans. Unfortunately, bank lending has been anemic throughout this recovery and consequently velocity has fallen. For instance, Bank of America had $876 Billion in loans at the end of 2007 which has grown to $923 Billion at the end of June 2017, a pedestrian growth of 5% over 10 years! Total lending growth from all the banks we follow has decreased from a middling 4% last year to an even lower 2% this year. It is difficult to see how inflation can pick up under such circumstances.
Figure 3: M2 Velocity
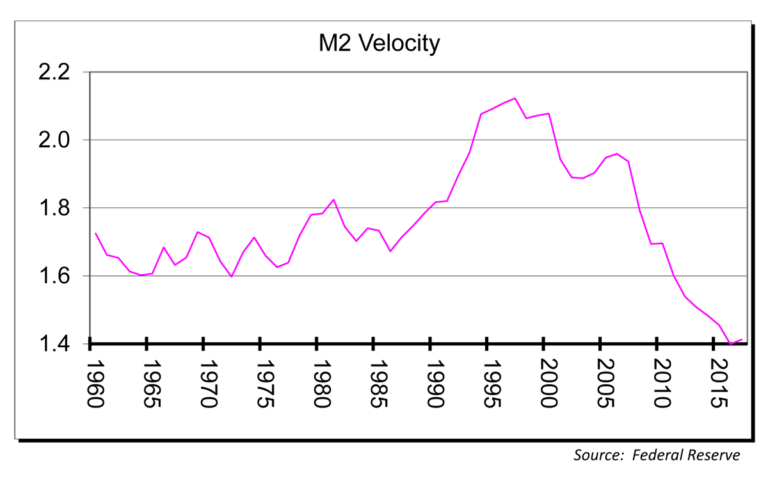
After a decade of monetary experimentation with questionable results, the Fed has recently announced a plan to withdraw the stimulus and shrink its balance sheet to an undefined level starting later this year. In our view, withdrawing the punch bowl will prove just as tricky, if not more so, as providing it. The Fed will have to undertake this experiment in an environment of already low inflation and excessive debt economy-wide. If it withdraws too quickly, it risks sending the economy into a catastrophic deflationary spiral. Conversely, doing nothing simply prolongs the inevitable adjustment that must be made. By our calculations, withdrawing the stimulus over a period of seven years (the same timeframe as the balance sheet expansion) to get back to a balance sheet of similar proportions as 2007, would require an annual decline of 14% in assets held by the Fed. At the end of the decline in 2024, the Fed would hold roughly $1.6 Trillion in assets. The shrinkage rate can be lower if the period is extended beyond 7 years.
There is concern in some quarters that the Fed stimulus, in lieu of inducing inflation and wage growth, has juiced the asset markets such as stocks and real-estate. If such concerns prove on the mark then a withdrawal of stimulus could potentially disrupt the asset markets, particularly popular names such as FAMAA. Our crystal ball is too cloudy to make such assertions.
CONCLUDING THOUGHTS
The stock market, particularly over the last five years, has been dominated by the performance of a select few names. Just 1% of the stocks in the S&P500, the Fab 5 (FAMAA), have generated 31% of the returns. Such a performance cannot continue indefinitely and a reckoning is to be expected at some point. At Alamar, we have avoided these names due to their overwhelming popularity, albeit to our detriment.
The Federal Reserve has finally announced the unwinding of their decade-long monetary experiment. Given the prevailing economic environment, the Fed will need to be very careful – checking out may prove to be more arduous than checking in. It remains to be seen if FAMAA will suffer from any withdrawal symptoms.
Thank you for your continued trust and confidence in Alamar Capital Management.
Sincerely,
George Tharakan, CFA
george@alamarcapital.com
Disclosures
The views expressed in this note are as of the date initially published and are subject to change without notice. Alamar has no obligation or duty to update the information contained in this note. Past performance is not an indication of future results. Risk is inherent in investments and involves the possibility of loss.
This publication is made available for informational purposes only and should not be used for any other purpose. This report should not be construed as a solicitation of an offer to buy or sell any security. Information contained herein was obtained and derived from independent third-party sources. Alamar Capital Management, LLC believes the sources are reliable; however, it cannot guarantee the accuracy of such information and has not independently verified the accuracy or completeness of such information.
This publication, and the information contained herein, may not be copied, reproduced, republished, or posted in whole or in part, in any form or media without the prior written consent of Alamar Capital.
ACM Commentary 1Q 2017
MARKET SUMMARY
In the first quarter of 2017 the market continued to reward investors. The bull market, now stretches into its 9-year bull run, with the S&P achieving a 6% gain in the quarter. In a reflection of an improving economy growth stocks considerably outperformed value thus far into 2017, with cyclical sectors, consumer discretionary, and information technology leading the way.
Further, Investors appear to have recognized an improving economic outlook beyond US shores, driving international stocks higher. Emerging markets led the charge with gains of over 11% in the first quarter thanks in part to a weaker US dollar.
The chart below displays the recent and historical performance of equity market indices around the globe.

The data shows healthy gains in the US Equity markets, across traditional market capitalization and even investment approaches, with both growth and value strategies participating in a similar fashion, especially over the past 5 years. Clearly, patient investors in the US markets who remained in the fold in recent years have been handsomely rewarded.
While the international and emerging market segments have struggled to keep up, leading some to believe that there may be some opportunity there.
Not surprisingly, in response to the market’s recent run, investors appear comfortably numb, with the CBOE Volatility Index (VIX), recently achieving a remarkable 23 year low of 9.8 in just the past few days. When the VIX hits 40 points or higher it signals considerable fear in the market, while a figure of 10 or lower is a sign of significant complacency.
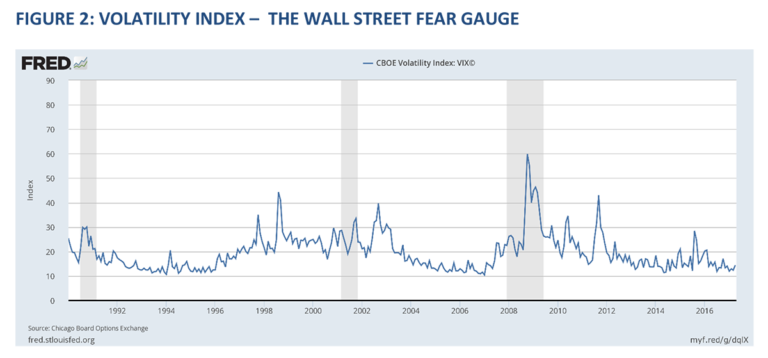
We find the market’s relative calm given expanded valuations, historically low rates, and considerable geopolitical and frankly even “tweet risk” somewhat curious, but not unprecedented. In a perhaps ominous sign to some, the last time the VIX reached these levels was in the months leading up to the housing crisis and subsequent great recession.
Though at Alamar we remain constructive on the state of the overall U.S. economy and markets, we believe it is important to remember our history. By no means are we predicting a market crash, however we do acknowledge that the future is uncertain, and whether we like it or not recessions are inevitable. Or as Meg McConnell of the New York Fed has said, “We spend a lot of time looking for systemic risk; in truth, in the end however, it tends to find us”.
THOUGHTS ON MARKET RISK
Clearly, valuations are not nearly as stretched as they were heading into the dot com crisis, and it is unlikely that residential housing will act as the culprit in the next major crisis as it did in 2007-08. What will be unique about the next correction though, is the extent to which investors are exposed to passive index funds, which assures them of capturing virtually all the market’s downside. Additionally, there is a tendency for many investors to chase returns in the later stages of a bull market, increasing their exposure to risk assets beyond their true comfort level at exactly the wrong time. These two phenomena combined, an increasing exposure to passive index funds, and expanding allocations to risk assets reminds us of a quote often attributed to boxing great Mike Tyson –
“Everyone has a plan until they get punched”
Studies of human behavior repeatedly point to the inability of investors to stay the course through tough times. Unfortunately, no one can duck all the punches that the market will throw their way. Though, ironically, in times of calm and particularly euphoria, we tend to think that we can, which can spell disaster for our investments.
There is a fair amount of evidence to support the notion that investors seem ill equipped to take a market punch. One way to see this is by comparing the performance of mutual funds against the actual returns experienced by their underlying investors. For instance, in order for an actual investor to have secured the 7.5% return provided by the S&P this past 10 years, they would have had to have stuck through an especially difficult round in 2008. However, because of their tendency to buy-high and sell low many investors end up earning a return much lower than the funds they choose to invest in. Mutual fund research company Morningstar tracks this information by measuring the impact of cash inflows and outflows from purchases and sales and the growth in a fund assets. By calculating when investors are putting money in and taking money out of a fund, they are then able to determine a return calculation on the experience of an “average fund investor”. The historical results of one such fund, the Vanguard 500 index mutual fund (VFINX) is shown in Figure 4.

As you can see, mutual fund investors have not struggled to stick with their position in VFINX the past several years, and have earned a return for themselves very much in line with the fund itself. However, when looking at their performance over 10-years, which incorporates a tough 2008, we see a much different story. During the period the fund’s investors secured just a 3.8% annualized return, underperforming the fund itself by a considerable margin (-3.6%)! Clearly, many investors were scared out of their investment and sold at or near the market’s low.
Compare this to the experience of investors in an active fund run by First Pacific Advisors, a company and management team that we admire. The Crescent Fund is conservatively managed and strives to provide equity like returns with less volatility than the market. The fund has lagged the overall market on a 1,3 and 5-year basis, while providing attractive returns over the longer haul, especially for their fund investors.

In fact, over 10 years the fund’s investors have managed to outperform the fund itself 7.3% vs 7.0%, which indicates investors buying at the low as opposed to selling. We believe that this is in large part due to the fund’s capital preservation approach, which resulted in considerable out performance in 2008 down just 20.6% (gulp), leaving investors more inclined to stick with and even add to their positions. They say there is no such thing as a free lunch, but you might have a tough time convincing long term average investors in the Crescent Fund. Through their positioning, and due to a smoother ride, they have been able to secure a return almost twice that of their peers in the Vanguard 500 Index mutual fund, and they have done so taking considerably less risk in the process! Given investors current propensity to utilize index funds in the management of their portfolios, it will be interesting to see whether this pattern doesn’t perpetuate itself in the future.
CONCLUDING THOUGHTS
At Alamar, we believe it is critical to understand what we own, why we own it, and what it’s worth in the management of our portfolios. This approach helps to remove some of the emotion associated with investing. Further, it is much more difficult to part with assets that are dear to us, when we know that they are selling at fire sale prices.
For our part, though we continue to be constructive on the market and at or near fully invested in our equity portfolios, we remain vigilant. We have seen our equity strategy compound at 13.6% net of fees since our inception in 2010. This result is slightly better than the S&P 500 over the same period, and with less risk. It is important to point out that it also exceeds our long-term expectations.
Though we do not believe that we can “time” the market, we have shown a willingness to raise cash in uncertain environments where we struggle to find investment ideas. Further, we are comforted by the high quality individual stocks that we do own, and are hopeful that their attributes and management teams will successfully steer us through inevitable future corrections. Additionally, through our Alamar Wealth Management offering, we can further diversify portfolios to meet our clients’ specific objectives, while recognizing their unique risk profiles.
Fortunately, the trick to successful investing is not avoiding being punched altogether, but rather training and positioning ourselves to survive a punch or two, and staying the course. Portfolios that are thoughtfully constructed and truthfully reflect the risk return profiles of their owners have a much higher likelihood of helping to accomplish this goal.
If you would like to meet with us to discuss your portfolio, or your overall investment positioning, please don’t hesitate to give us a call.
Thank you for your continued interest and consideration –
Sincerely,
John Murphy, CFA
DISCLOSURES
The views expressed in this note are as of the date initially published and are subject to change without notice. Alamar has no obligation or duty to update the information contained in this note. Past performance is not an indication of future results. Risk is inherent in investments and involves the possibility of loss. Net of fee performance is calculated using the highest fee. The Russell 3000 Index measures the performance of the largest 3000 U.S. companies representing approximately 98% of the investable U.S. equity market. The S&P 500 Index, which is a market-capitalization weighted index containing the 500 most widely held companies chosen with respect to market size, liquidity, and industry.
This publication is made available for informational purposes only and should not be used for any other purpose. This report should not be construed as a solicitation of an offer to buy or sell any security. Information contained herein was obtained and derived from independent third-party sources. Alamar Capital Management, LLC believes the sources are reliable; however, it cannot guarantee the accuracy of such information and has not independently verified the accuracy or completeness of such information.
This publication, and the information contained herein, may not be copied, reproduced, republished, or posted in whole or in part, in any form or media without the prior written consent of Alamar Capital.
ACM Commentary 4Q 2016
The election of Donald Trump as the next US President led to a furious market rally in the 4th quarter. The S&P500 was up almost 6% in the last 2 months of the year, roughly half of the full year’s gain of 12%. Most of the gains were led by the cyclical sectors of the economy such as banks and industrials. Unfortunately, we were not expecting such an election outcome and, as has been the case for many years, had no exposure to banks. As a result we were up 4.1%, net of fees, for the full year. We typically do not invest in “high-flyers” or momentum names and therefore the risk we incur is less than the market. Our “beta” (a measure of risk) continues to be less than the market and on a risk-adjusted basis we have outperformed the market since inception by 3.2% annually (also known as “alpha” in the investing vernacular).
The economy continues to chug along at a moderate pace and President Trump will face some financial constraints to bring his election promises to fruition. We will discuss both the current state of the economy and the potential headwinds in this writing.
THE 1-2-3 ECONOMY
First, some clarification of economic terminology: while the press and economic commentators focus on real GDP growth, what matters to companies and investors is nominal GDP. Nominal GDP is the current value of all economic output while real GDP is the size of economy after adjusting for inflation. When companies report revenues and profits we are looking at nominal numbers, not adjusted for inflation. As seen in Figure 1, nominal growth has recently slowed to roughly 2% in 2016 from 4% earlier in the recovery. The average growth rate of the US economy from 2010 is roughly 3%. We call this the 1-2-3 economy: roughly 1% inflation and 2% real GDP growth leading to 3% nominal growth. The 1-2-3 economy is also supported by the results posted by large retailers such as Costco & WalMart which sell everything from soap to cars. WalMart has reported sub-3% same-store sales ever since the recovery began while Costco reported higher growth earlier in the recovery but has reported sub-3% same-store sales since early 2015. We estimate total loan growth reported by banks will also be less than 3% once the final 2016 numbers are tabulated.
Note that the 1-2-3 economy is very different from growth rates experienced prior to the 2008 recession. Back then nominal growth rates were more like 6% as seen in the figure. We refer to those halcyon days as the 3-3-6 economy (3% inflation & 3% real GDP leading to 6% nominal growth). As can be surmised, the difference between 3% and 6% growth is enormous, over time. In a decade, the 6% economy will be 33% larger than a 3% economy. A faster economy results in more sales, higher wages and a better standard of living. Investors also pay up for faster growth – to earn a 10% return, investors will pay a 25x P/E multiple for 6% growth but only a 14x multiple for growth of 3% since higher growth warrants a lower P/E multiple.

THE FISCAL STRAITJACKET
President Trump has come into office promising tax-cuts & more government spending. Some commentators are expecting a reprise of President Reagan’s eight years in office. It is difficult to see how this policy will not widen the budget deficit even further and balloon the debt into more treacherous waters. As of Dec 31, 2016, total federal debt stood at $19.98 Trillion, up from $10.7 Trillion when President Obama took office in 2009. Note this number excludes all off-balance sheet obligations such as future Social Security & Medicare spending. Figure 2 depicts total debt outstanding since 1940. The increase since 2000 has been extraordinary. Debt doubled during President Bush’s eight years in office and then doubled again under President Obama. However, the income to support this debt, nominal GDP, did not rise commensurately. Figure 3 shows debt-to-GDP ratio during the same period. Total debt to GDP was 32% when President Reagan assumed office in 1981. Overall debt levels were not very high when he came to power and he enjoyed the fiscal flexibility to cut taxes but not spending leading to a booming economy. When Bill Clinton assumed the presidency debt-to-GDP was 61% and President Obama inherited a 68% debt-to-GDP fiscal environment.
President Trump, however, faces a very different situation than any of his predecessors in the last 50+ years. Overall debt is now over 100% of GDP and his room for budget maneuverability is therefore substantially reduced. For instance, the government has reduced the interest payments on its debt through a combination of reducing the maturity and the Federal Reserve lowering interest rates. If the interest rate on the debt outstanding jumped up to say 3%, the average rate just prior to the 2008 financial crisis, total interest payments in the Federal Budget would rise to over $600 Billion or 15% of total government outlays, matching spending on Defense or Medicare. Such an increase would choke off government spending in other areas constraining fiscal stimulus. If outstanding debt increases at the same rate as in the prior 16 years then the fiscal trade-offs would be even worse. Given such fiscal constraints, President Trump will have to rely on the private sector to spur growth through reduced regulatory burdens and tax incentives. Private investment, lagging behind during this recovery until now, will have to step in for fiscal stimulus.

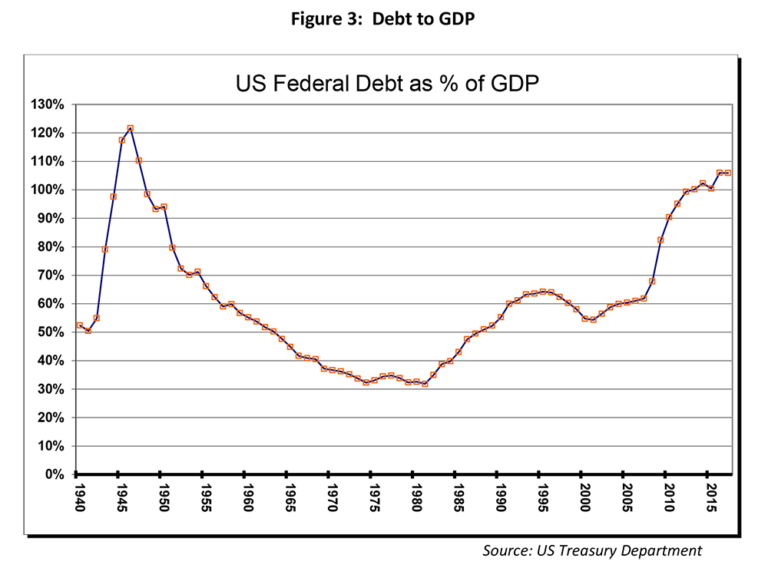
CONCLUDING THOUGHTS
Growth is anemic and both investors and the electorate are clamoring for better days as seen by the surprising election of Donald Trump. It remains to be seen if President Trump’s policies will ignite the animal spirits. The market has already run-up in anticipation of good tidings. At Alamar, we will be watching carefully to see if economic momentum is picking up.
Unlike the previous presidents over the last 5 decades, President Trump faces a fiscal vise built up over the last 16 years. Debt-to-GDP is now well over 100% and any increase in interest rates will quickly escalate interest payments on this debt, choking spending in other areas. The President will need to carefully navigate the land-mines to get the economy to hum without further adding to the debt burden.
Thank you for your continued trust and confidence in Alamar Capital Management.
Sincerely,
George Tharakan, CFA
george@alamarcapital.com
Disclosures
The views expressed in this note are as of the date initially published and are subject to change without notice. Alamar has no obligation or duty to update the information contained in this note. Past performance is not an indication of future results. Risk is inherent in investments and involves the possibility of loss.
This publication is made available for informational purposes only and should not be used for any other purpose. In particular, this report should not be construed as a solicitation of an offer to buy or sell any security. Information contained herein was obtained and derived from independent third-party sources. Alamar Capital Management, LLC believes the sources are reliable; however, it cannot guarantee the accuracy of such information and has not independently verified the accuracy or completeness of such information.
This publication, and the information contained herein, may not be copied, reproduced, republished, or posted in whole or in part, in any form or media without the prior written consent of Alamar Capital.